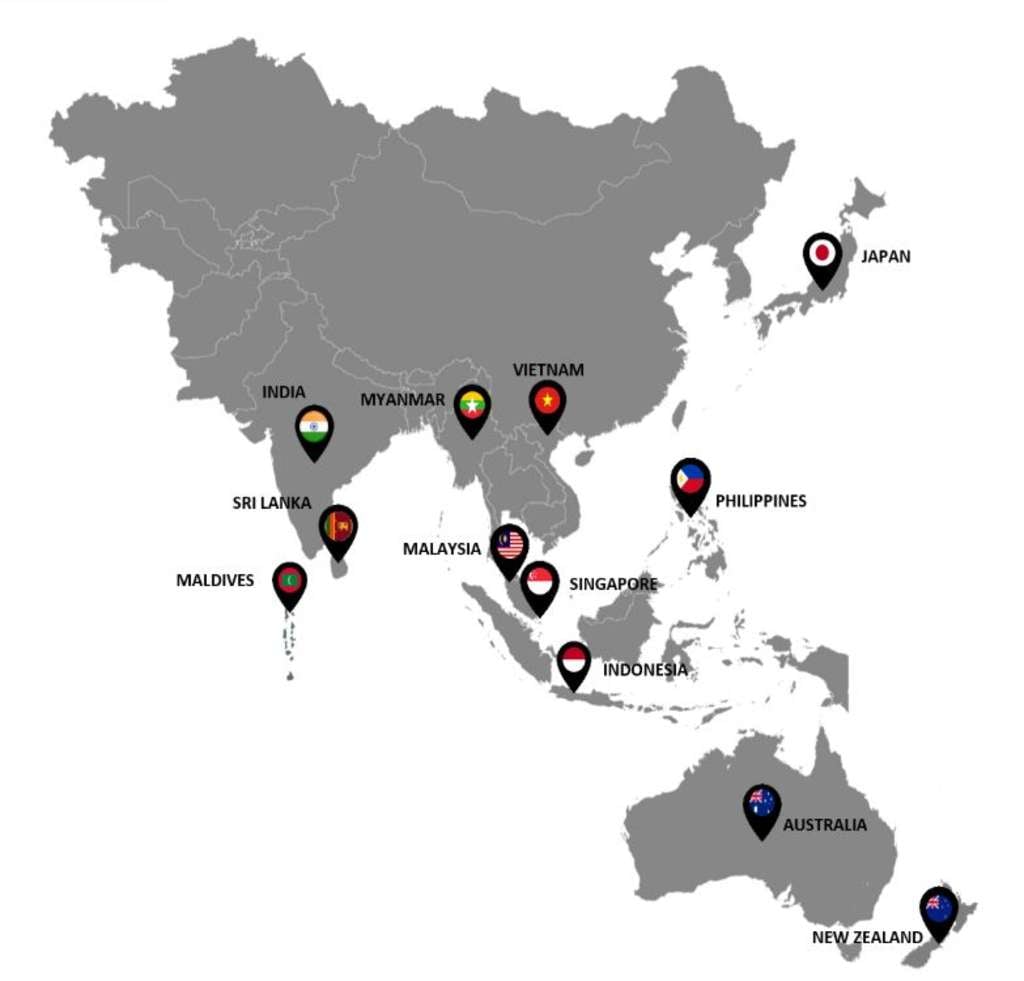
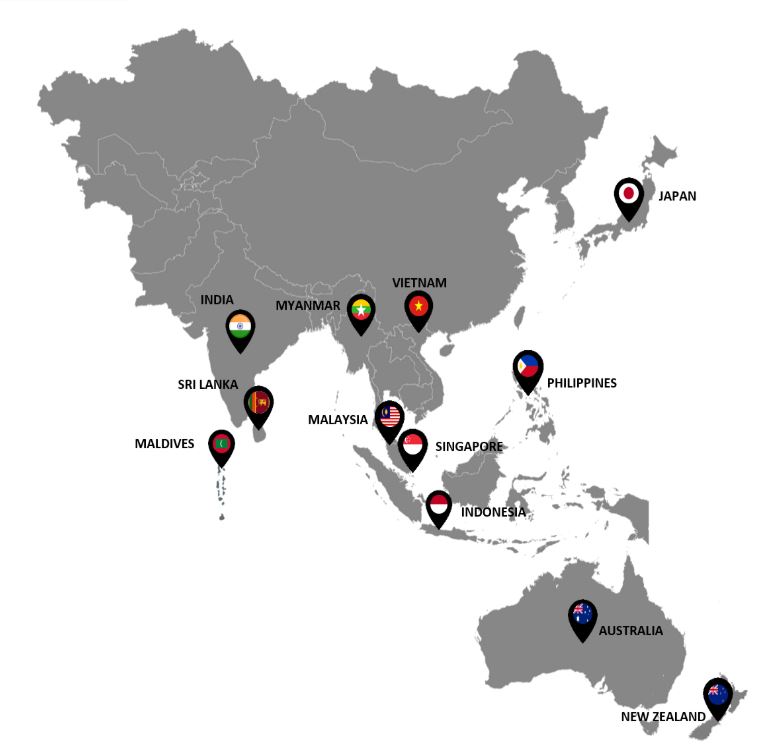
Market Snapshot: Asia Pacific 2019
Transactions in Asia Pacific
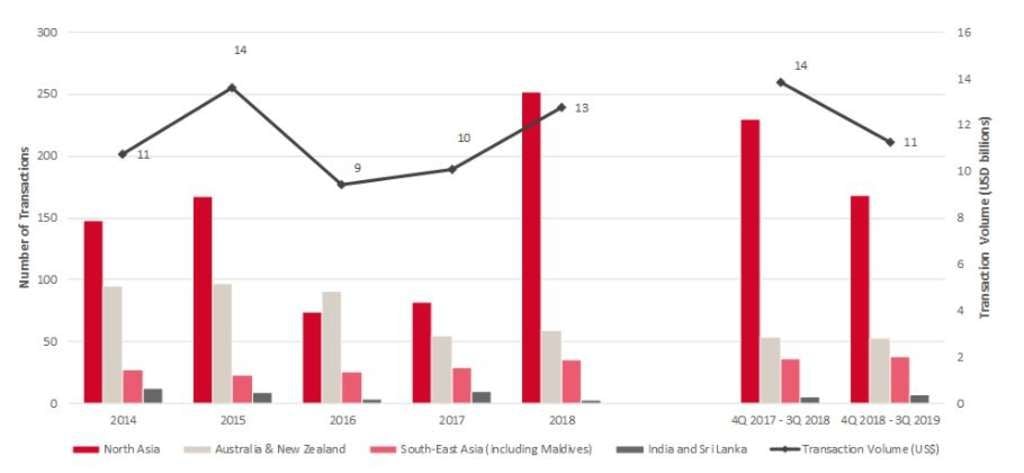
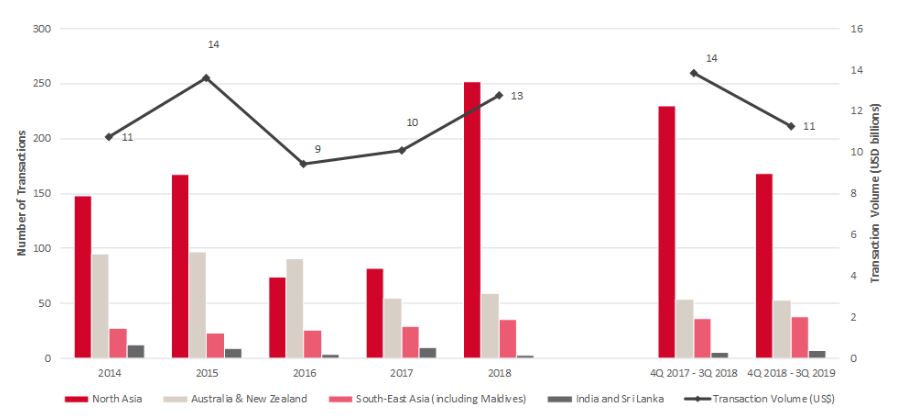
In 2018, transaction activity in Asia Pacific continued its strong momentum from 2017 and achieved transaction volume of approximately USD12.8 billion worth of hospitality assets, indicating a 26.6% increase year-on-year. From 4Q2018 to 3Q2019, transaction activity in Asia Pacific has slowed down. Despite the reduced transaction activity, growing interest in hospitality assets continue to be observed in regions such as Australia & New Zealand, India & Sri Lanka and specific markets in the North Asia and South-East Asia regions.
For some markets, the slowdown can be attributed to various factors including political instability, weakening market performance and a cautious macro economical outlook with uncertainties brought about by the China-United States trade war. However, for other markets, interest remains strong and is curbed by limited investment opportunities and the mismatch in pricing expectations between investors and sellers.
Transaction History in Asia Pacific (2014 - 3Q 2019)
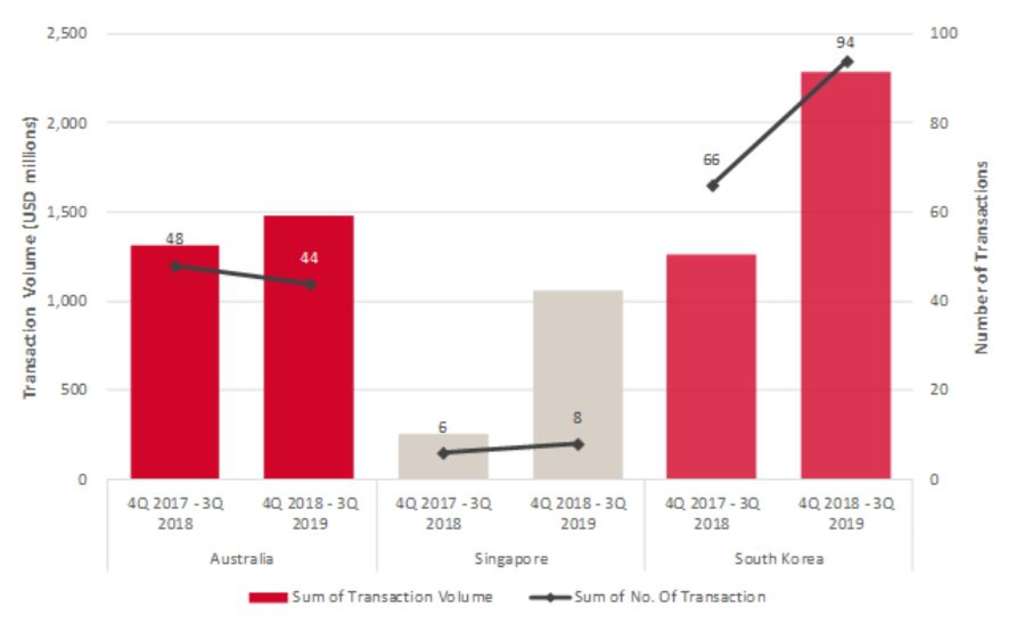
Top Three Most Active Markets (4Q 2018 to 3Q 2019)
Strong investors appetite for hospitality assets is observed over the last four quarters (4Q 2018 - 3Q 2019) in Australia, Singapore and South Korea. Transaction volume for the three identified markets has seen an increase over the previous four quarters, alongside an increase in the number of transaction in all markets except Australia. In particular, South Korea has seen transaction volume soared from USD 1.3 billion to USD2.3 billion with 94 hospitality assets having traded hands.
Top Three Most Active Markets (4Q 2018 - 3Q 2019)

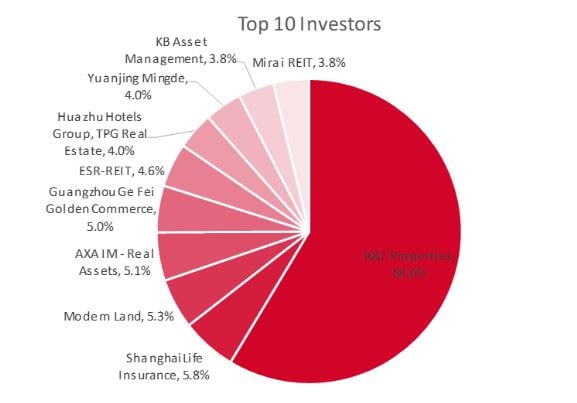
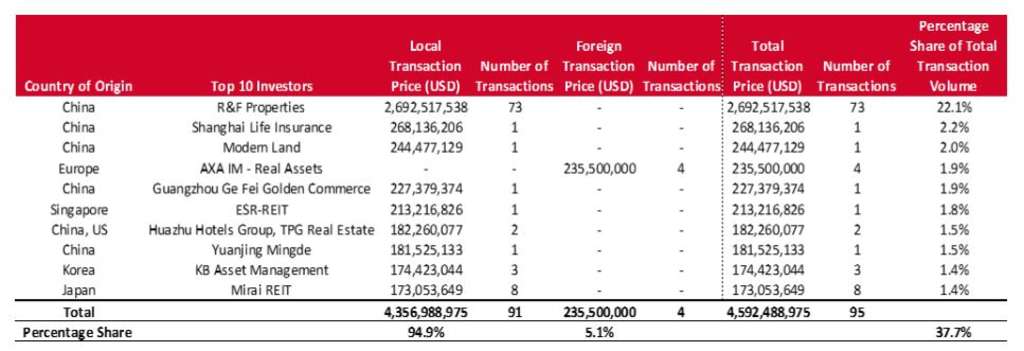
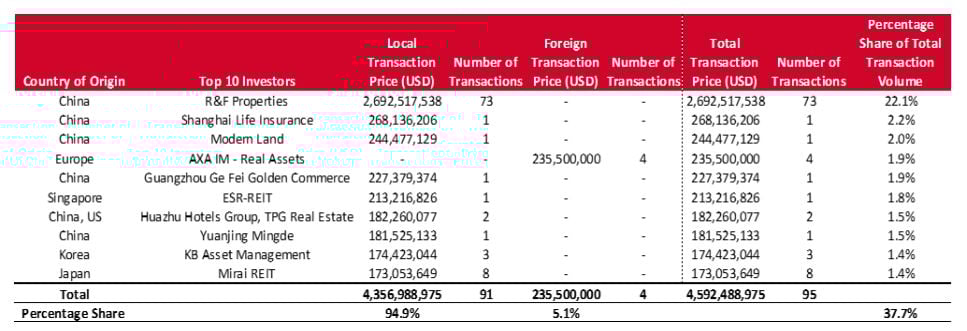
Major Investors in Asia Pacific
In 2018, transaction activity from the top ten investors in Asia Pacific accounted for approximately USD4.6 billion or 37.7% of total transaction volume. Majority of the transaction volume by the top ten investors are local investments (investment in country of origin), representing approximately USD4.4 billion. This indicates that local investors have been active in their home markets. However, Japan has seen an increasing interest from foreign investors: Singapore and the United States (US), in 2018. Similarly, Australia had witnessed foreign investor interests from Hong Kong, Japan, Singapore and the US. AXA Investment Managers (IM) - Real Assets had invested in Australia with three properties in Sydney and one in Canberra. Out of these top ten investors, six of them are based in China. R&F Properties emerges as the top investor upon the acquisition of Dalian Wanda's portfolio of 73 properties in 66 cities in China.

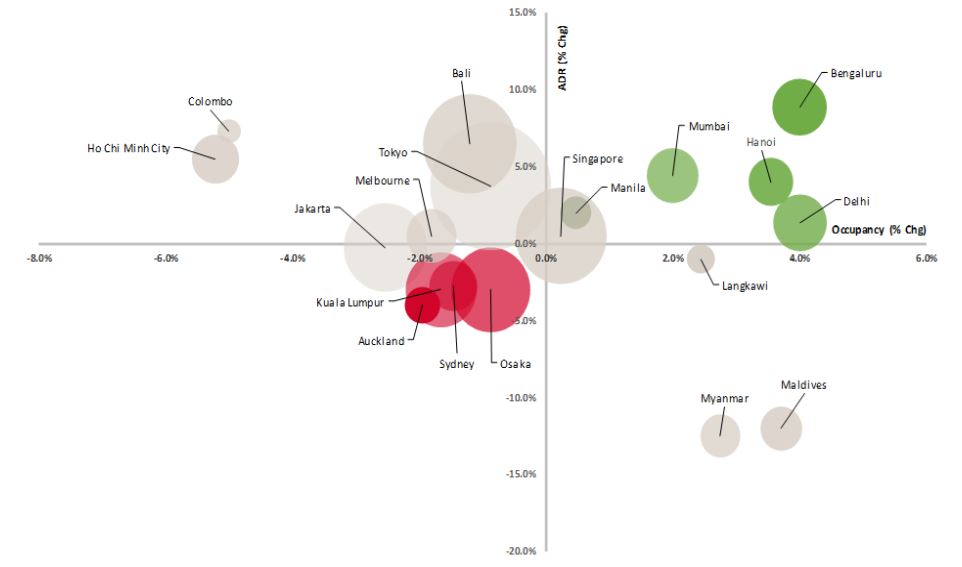
Hotel Performance in Asia Pacific (2019)
Overall hotel performance across the tracked markets experienced mixed sentiments for 2019. Despite growth in tourism arrivals, the ever-changing political climate, mercurial global economical conditions and growth in accommodation supply are few of the many reasons that continue to put downward pressure on several markets. Despite the headwinds, the underlying dynamics behind demand growth is observed to be resilient, and is expected as such going forward.
While most markets are affected due to the supply-demand dynamics, the following few markets have unconventional factors that affect the forecast for 2019. Despite strong demand growth in Maldives, the increase of midscale properties being tracked resulted in an overall decline in average rates. While growth in accommodation supply in Ho Chi Minh City is limited, the introduction of apartments affected demand for the extended stay segment.

Key Points
- Tourism directly contributes 3.0% to GDP in 2018
- 2.2% Real GDP growth expected in 2019
- 9.2 million international tourist arrivals recorded in 2018
Highlights
Infrastructure Projects
- A$3.5 billion redevelopment of Melbourne Airport, by 2023
- A$330 million roadwork upgrade of Outback Way between Western Australia and Queensland by 2025
- A$6-8 billion construction of Sydney West Airport by 2026
New Hotel Openings in Sydney and Melbourne
2020-2022
• Luxury: 9 Hotels, 3,093 keys
• Upper Upscale: 17 Hotels, 2,926 keys
• Upscale: 14 Hotels, 2,663 keys
• Upper Midscale: 15 Hotels, 2,875 keys
• Midscale: 3 Hotels, 376 keys
• Economy: 15 Hotels, 3,381 keys
Notable Transactions
- 112-key Veriu Central Hotel in Sydney CBD transacted at A$55.0 million (A$491,071/key) in August 2019
- 119-key Seasons Harbour Plaza Sydney in Sydney CBD, transacted at A$81.0 million (A$680,672/key) in August 2019
- 250-key Ibis Melbourne Hotel & Apartments in Melbourne CBD, transacted at an undisclosed amount in September 2019
Demand
In the first six months of 2019, tourist arrivals displayed positive year-on-year (y-o-y) growth of 2.9%. In 2018, China overtook New Zealand as the top source market, owning a 15.5% market share. As of year-to-date (YTD) June 2019, New Zealand recorded a higher y-o-y growth of 3.6% as compared to China which witnessed a marginal y-o-y growth of 0.1%. The growth from New Zealand could possibly be due to the tourism promotion efforts by Tourism Australia.
Supply
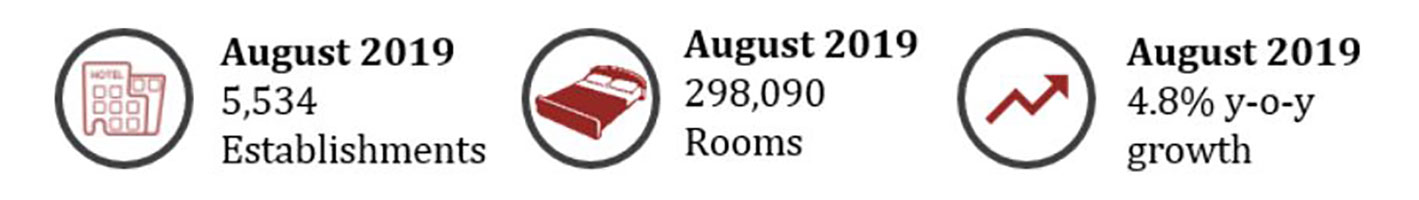
HVS has noted that, going forward, there will be 162 additional hotels with approximately 30,597 keys in Australia by 2022.
Sydney and Melbourne Hotel Performance 2018 vs. 2019F
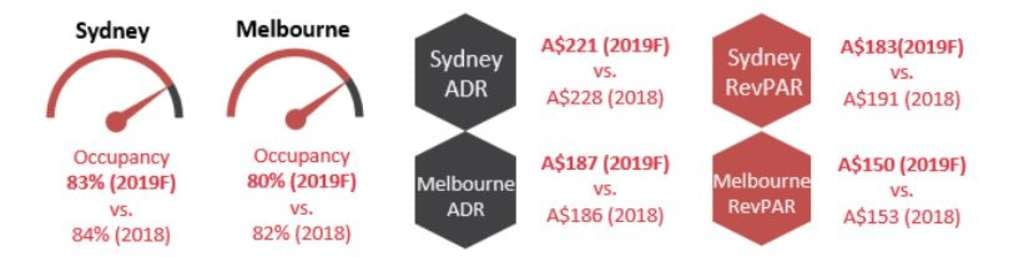

As of YTD August 2019, hotel occupancy in Sydney decreased by 1.6 percentage points (p.p.). Similarly, occupancy in Melbourne decreased by 2.4 p.p. Sydney's room rates decreased by 3.3% y-o-y, while Melbourne's room rates increased marginally by 0.1%.
Transactions
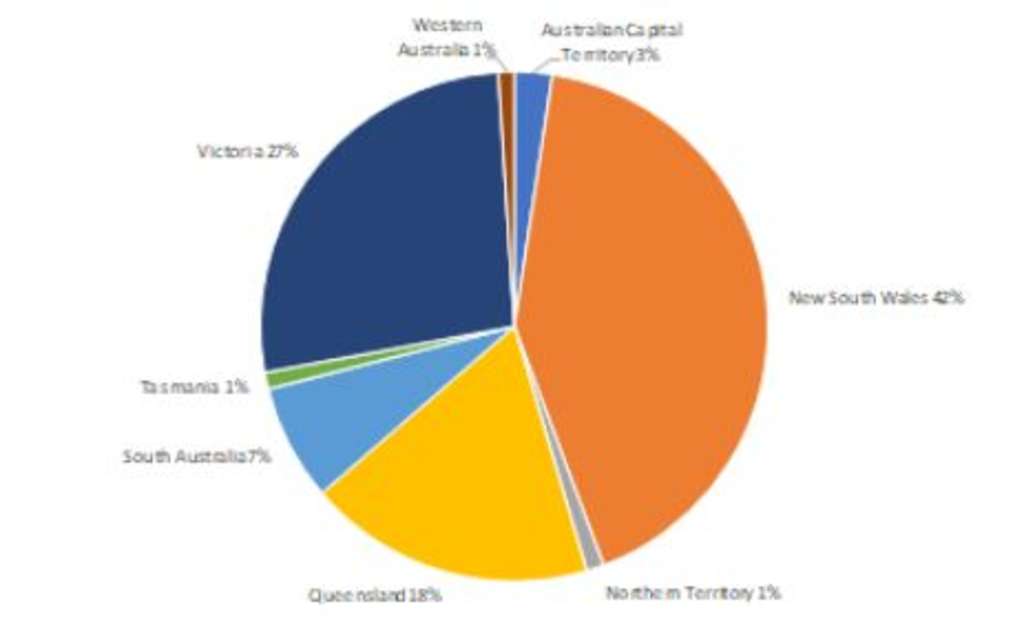
From 4Q 2018 to 3Q 2019, New South Wales has recorded the highest transaction volume, amounting to 42% of the total transaction volume in Australia. This is followed by Victoria with 27% and Queensland with 18%. Despite healthy level of transactions recorded in 2019, only one transaction was recorded in Melbourne CBD, Victoria and two transactions were recorded in Sydney CBD, New South Wales.
Hotel Transaction Volume By Market (4Q 2018 - 3Q 2019)


Key Points
- Tourism directly contributes 3.7% to GDP in 2018
- 5.2% Real GDP growth expected in 2019
- 10.5 million international tourist arrivals recorded in 2018
Highlights
Infrastructure Projects
- Central government plans to invest INR100 trillion for infrastructure development over the next five years, by 2025
- The Good & Services Tax (GST) Council has reduced the taxes and changed the tax slabs on hotel accommodation, which is expected to fuel demand
New Hotel Openings in Delhi NCR, Mumbai and Bengaluru
2019 (Top Two Largest Inventory)
• IHCL SeleQtions - Connaught Hotel, New Delhi, 104 keys
• Marriott Executive Apartments Bengaluru, 102 keys
2019-2022
• Luxury: 4,567 keys
• Upper Upscale: 6,671 keys
• Upscale: 11,203 keys
• Midscale: 16,202 keys
Notable Transactions
- The Gateway Hotel Beach Road Visakhapatnam transacted at INR1.2 billion in October 2019
- Singapore's sovereign wealth fund GIC acquired 49% stake in Provenance Land, an Indian developer that owns India's first Four Seasons hotel and an under-construction luxury development project in Mumbai for over INR10 billion in August 2018
Demand
In the first eight months of 2019, tourist arrivals amounted to approximately 6.88 million, registering a growth of 2.1% over the same period last year. Given its close proximity, Bangladesh is the top source market, with a share of 21.5% (in 2017), followed by the US (13.7%) and the UK (9.8%) during the same period. Domestic visitors continue to play a major role due to their sheer volume, accounting for approximately 1,652 million in 2017, registering a growth of 2.3% over the previous year.
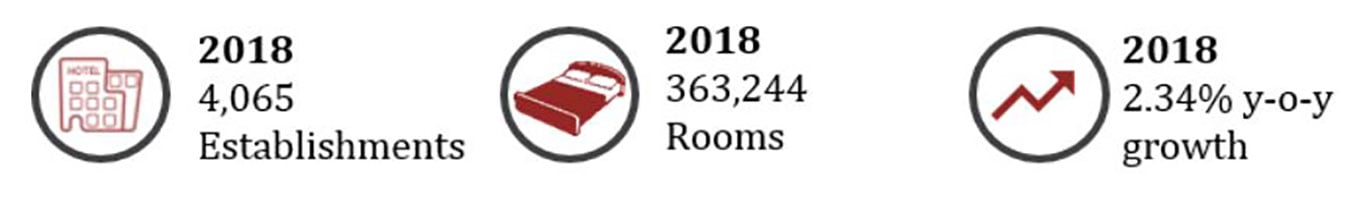
Supply*

HVS has noted that, going forward, 38,643 branded keys spreading across 337 properties are expected to open by 2022. Majority of the upcoming supply is expected to be in the mid-scale segment.
Delhi NCR, Mumbai and Bengaluru Hotel Performance 2018 vs. 2019F
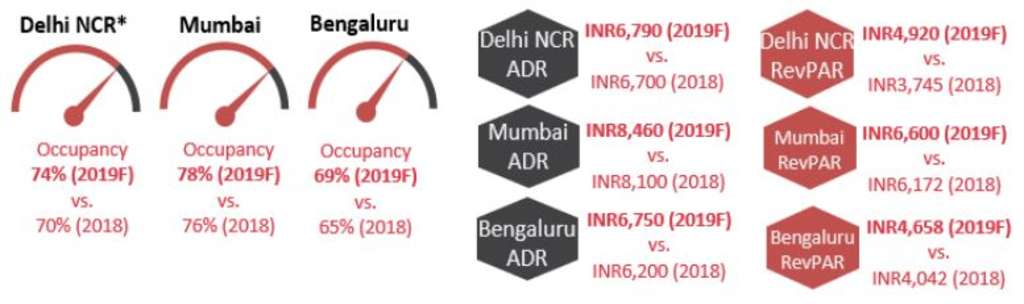
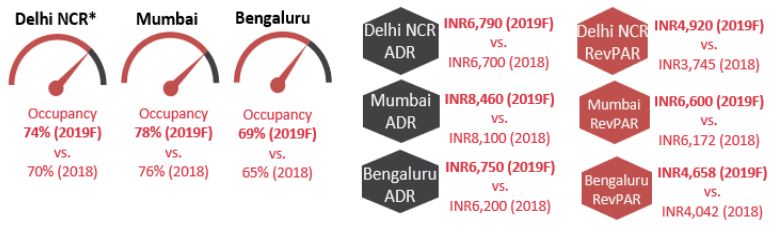
As of YTD July 2019, hotel occupancy in Mumbai increased marginally by 0.5 percentage points (p.p.), while occupancy in Bengaluru and Delhi increased by 2.7 p.p and 2 p.p, respectively. Bengaluru's room rates increased by 8.9% y-o-y, while Mumbai's and Delhi's room rates increased by 4.4% and 1.6%, respectively.
Transactions
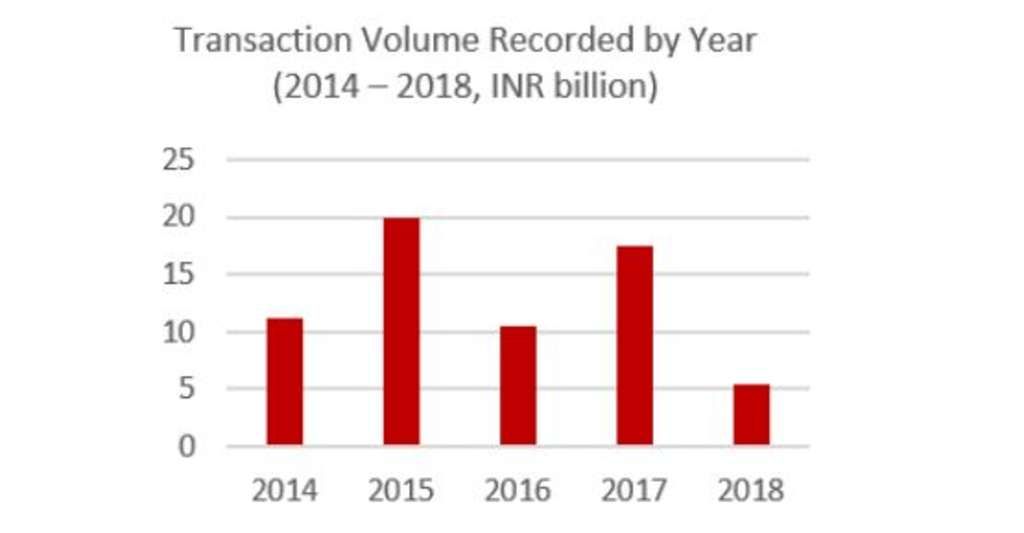
The total transaction volume has contracted since peaking in 2015. Transaction volumes are expected to pick up in 2019 on the back of distressed pricing of hotel assets. Many deals are in the pipeline, and should they transact, the deal volume could potentially reach US$800 million for 2019, setting a record for hotel transactions in the country.
Transaction Volume Recorded by Year (2014 - 2018)


Key Points
- Tourism directly contributes 1.9% to GDP in 2018
- 5.1% Real GDP growth expected in 2019
- 15.8 million international tourist arrivals recorded in 2018
Highlights
Infrastructure Projects
- Infrastructure development budget of Rp400 trillion allocated for 2019
- Plans to develop ten new airports to support tourism
New Hotel Openings in Bali and Jakarta
2019 (Top Three Largest Inventory)
• Novotel Jakarta Pantai Indah Kapuk Sedayu, 429 keys
• Swissotel Jakarta PIK Avenue, 412 keys
• Swissotel Jakarta Pantai Indah Kapuk, 412 keys
2020-2022
• Luxury: 13 Hotels, 2,267 keys
• Upper Upscale: 11 Hotels, 2,294 keys
• Upscale: 14 Hotels, 3,076 keys
• Upper Midscale: 9 Hotels, 2,110 keys
• Midscale: 4 Hotels, 698 keys
• Economy: 1 Hotel, 126 keys
• Independent: 4 Hotels, 458 keys
Notable Transactions
- 6.7% interest in 147-key Four Seasons Resort Bali At Jimbaran Bay transacted for Rp0.72 trillion (Rp0.5bn/key)
Demand
As of YTD June 2019, despite the declining airport arrivals in Soekarno Hatta and Ngurah Rai International Airport, overall tourism arrivals in Indonesia remain robust with over 7.8 million visitations, outstripping the previous period's arrival by 4.0%. Malaysia maintained its position as Indonesia's top source market with over 1.6 million visitations while China remains strong in second with moderated growth in visitation by 0.2%. Singapore follows in third with a substantial growth in arrivals by 16.5%.
Supply

HVS has noted that, going forward, there will be 194 additional hotels comprising approximately 36,479 keys in Indonesia by 2022, having 24 hotels opened in the first three quarters of 2019.
Jakarta and Bali Hotel Performance 2018 vs. 2019F
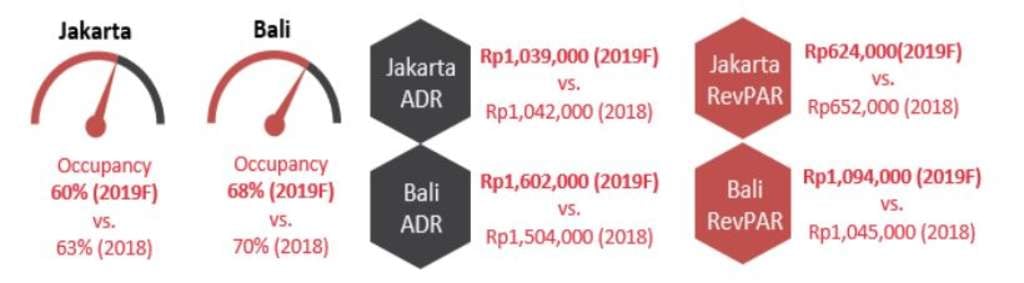
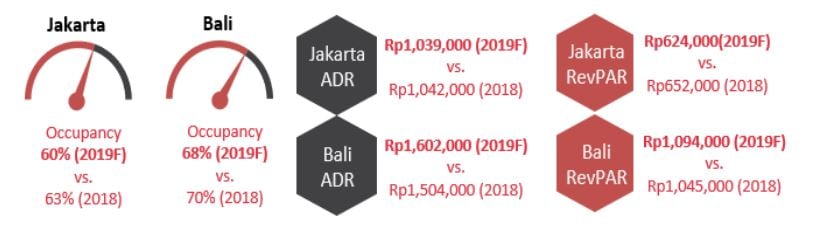
Both Jakarta and Bali showed a y-o-y decline in occupancy by 3.1 p.p. and 1.7 p.p. respectively, as of YTD August 2019. Bali, as a popular tourist destination, maintained its competitiveness in room rate with a 6.5% y-o-y growth whereas Jakarta saw a decrease in room rates by 4.5%.
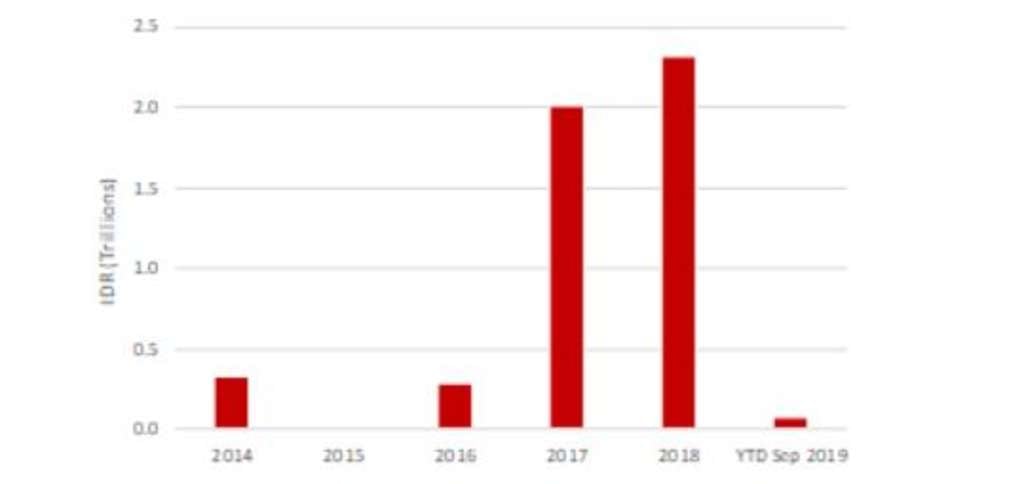
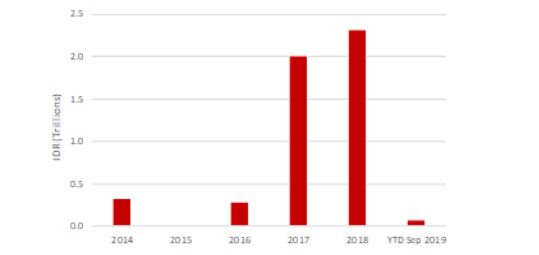
Transactions
After the bottoming in 2015, transaction volume has been increasing with an overall transaction volume of Rp5.0 trillion recorded between 2016 to YTD September 2019. In June 2019, partial interest of Four Seasons Resort Bali At Jimbaran Bay has been transferred to Hotel Properties Limited for Rp0.72 trillion. Additionally, we note that two properties transacted for an undisclosed amount this year; the Grand Hyatt Jakarta and a hotel from the Plaza Indonesia Realty portfolio.
Transaction Volume Recorded by Year (2014 - YTD Sep 2019)


Key Points
- Tourism directly contributes 2.2% to GDP in 2018
- 1.0% Real GDP growth expected in 2019
- 31.2 million international tourist arrivals recorded in 2018
Highlights
Infrastructure Projects
- First phase of the Maglev line by 2027 (Shinagawa-Nagoya), 2037 (Nagoya-Osaka)
- ¥160 billion expansion of Narita International Airport by 2020
- Expansion of Haneda International Airport by 2020
- ¥100 billion expansion of Kansai International Airport by 2025
New Hotel Openings in Tokyo & Osaka
2019 (Top Three Largest Inventory)
• Hotel Hankyu Respire Osaka, 1,032 keys
• APA Hotel & Resort Midosuji Honcho Station Tower, 913 keys
• Liber Hotel at Universal Studios Japan, 760 keys
2020-2022
• Luxury: 5 Hotels, 900 keys
• Upper Upscale: 5 Hotels, 1,127 keys
• Upscale: 16 Hotels, 7,364 keys
• Upper Midscale: 5 Hotels, 1,932 keys
• Midscale: 2 Hotels, 372 keys
• Independent: 24 Hotels, 8,165 keys
Notable Transactions
- 453-key Hilton Tokyo Odaiba sold for ¥62.4 billion (¥138m/key) in Apr 2019
Demand
In the first half of 2019, tourist arrivals witnessed a 4.6% y-o-y growth, recording 16.6 million. China maintained in pole position as the leading source market making up 27% of total arrivals as of YTD June 2019, with a y-o-y growth of 11.7%. Despite a decline of 3.8% y-o-y, Korea remain in close second, representing 23% of total arrivals. The downward trend is anticipated to continue due to the trade row with Korea.
Supply

HVS has noted that, going forward, there will be 95 additional hotels with approximately 31,600 keys in Japan by 2022; 29 properties with a total of approximately 9,400 rooms will open by the end of 2019.
Tokyo and Osaka Hotel Performance 2018 vs. 2019F
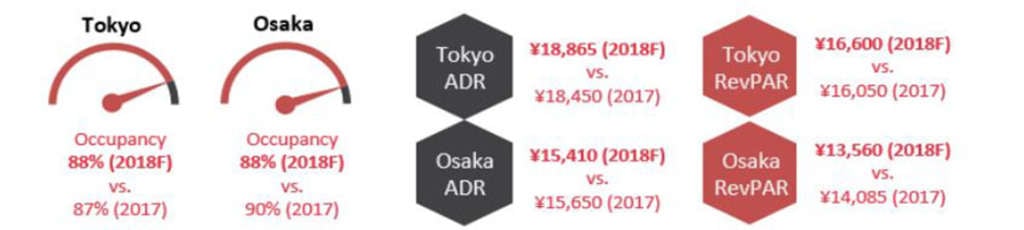

As of YTD August 2019, occupancy of Tokyo hotel market recorded a y-o-y decrease of 1.3 p.p. while Osaka hotel market recorded a y-o-y decrease of 0.7 p.p. Tokyo's room rates witness strong y-o-y growth of 4.0%, while the downward momentum on rates continued in Osaka.
Transactions
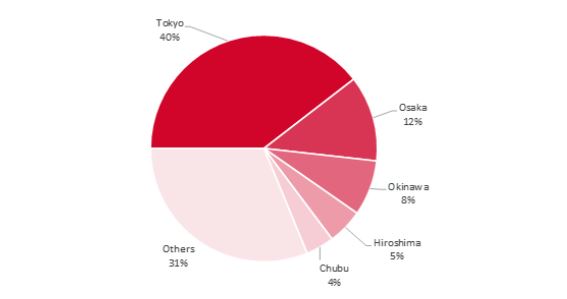
Transaction volume reached ¥133.2 billion with 20 recorded transactions within the first nine months of 2019, an increase of 19% over the same time last year. Transactions are predominantly in Tokyo and Osaka, which accounts for approximately 40% and 12% of total recorded transactions, respectively. Japan's hotel investment market continue to be dominated by local investors.
Hotel Transaction Volume by Location (2014 - YTD Sep 2019)


Key Points
- Tourism directly contributes 5.8% to GDP in 2018
- 4.4% Real GDP growth expected in 2019
- 25.8 million international tourist arrivals recorded in 2018
Infrastructure Projects
- RM29 billion Pan Borneo Highway by 2021
- RM4.4 billion airport upgrade and expansion for Kuala Lumpur, Johor, Penang, Kedah, Sabah and Selangor by 2021
- RM32-40 billion construction of Mass Rapid Transit Line 2 by 2022
New Hotel Openings in Kuala Lumpur and Langkawi
2020-2022
• Luxury: 6 Hotels, 1,998 keys
• Upper Upscale: 4 Hotels, 1,342 keys
• Upscale: 4 Hotels, 1,066 keys
• Upper Midscale: 7 Hotels, 1,746 keys
• Midscale: 3 Hotels, 773 keys
Notable Transactions
- 258-key Tune Hotel Penang in Georgetown sold for RM21 million (RM81k/key) in April 2019
- 275-key Brisdale Hotel in Kuala Lumpur sold for RM26 million (RM94k/key) in February 2019
Demand
An upward trend was observed in 2019 for tourist arrivals in Malaysia, recording a 4.8% increase in YTD May arrivals. Singapore (40.5%) and Indonesia (13.7%) remains the top two source markets, with both recording an increase in arrivals of 4.0% and 14.3% y-o-y growth, respectively. Out of Malaysia's top ten source market, arrivals from Singapore and Brunei have recorded a decline in arrivals.
Supply

HVS has noted that, going forward, there will be 97 additional hotels with approximately 27,417 keys in Malaysia by 2022.
Kuala Lumpur and Langkawi Hotel Performance 2018 vs. 2019F
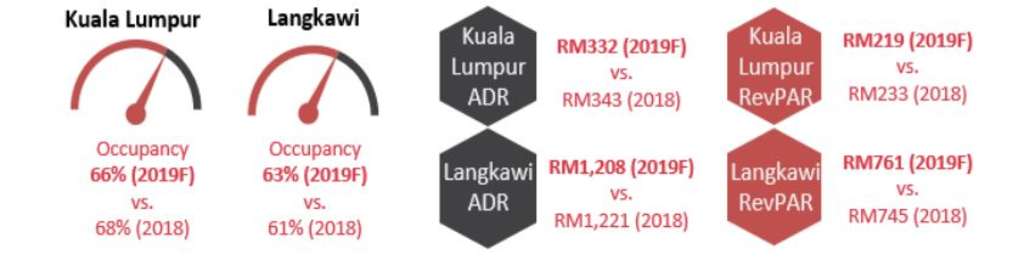

As of YTD August 2019, Kuala Lumpur recorded a y-o-y decrease in occupancy of approximately 2.0 p.p. Similarly, Kuala Lumpur's room rates saw a decline of 5.7% y-o-y. Based on HVS estimates, occupancy in Langkawi is forecasted to increase to 63% in 2019. However, rooms rates in Langkawi is projected to decrease to support occupancy growth.
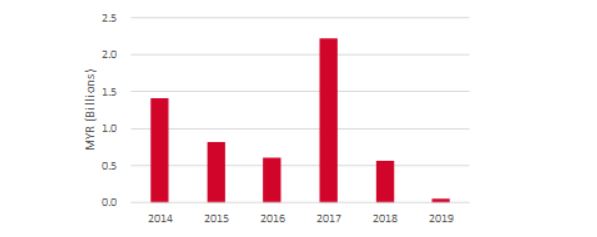
Transactions
Malaysia's hotel transactions reached approximately RM56 million as of YTD September 2019, a slow down from 2018's volume of transactions. The high volume in 2017 was reflective of positive sentiment in the hotel market across the country as tourism recovered from its lacklustre performance in 2015 and 2016. Over the last five years, Kuala Lumpur accounted for 19 of the 49 recorded transactions.
Transaction Volume Recorded by Year (2014 - YTD Sep 2019)


Key Points
- Tourism directly contributes 32.5% to GDP in 2018
- 5.0% Real GDP growth expected in 2019
- 1.48 million international tourist arrivals recorded in 2018
Highlights
Infrastructure Projects
- Opening of three domestic airports, Maavarulu Airport, Funadhoo Airport and Madivaru Airport by the end of 2019
- Additional two domestic airports, Faresmaathodaa Airport and Hoarafushi Airport scheduled to open in 2020
New Resort Openings in Maldives
2019
• Radisson Blu Resort Maldives, 128 keys
• Varu by Atmosphere, 108 keys
2020-2022
• Luxury: 3 Resorts, 240 keys
• Upper Upscale: 4 Resorts, 1,035 keys
• Upscale: 4 Resorts, 520 keys
• Upper Midscale: 1 Resort, 200 keys
• Independent: 1 Resort, 88 keys
Notable Transactions
- 39-key Mirihi Island Resort transacted at US$32 million (US$822k/key) in December 2018
- 125-key Bodufaru Beach Resort sold at US$91 million (US$726k/key) in July 2019
Demand
In the first half of 2019, tourist arrivals displayed robust growth, with YTD April 2019 arrivals of 646,000 outstripping last year's arrival by a remarkable 20%. China, the top source market for Maldives has seen a consistent decline since 2016, recording a decrease by 7.6% in 2018. Maldives continues to welcome a growing number of visitors from Italy, Russia, France and United Kingdom with a combined growth of 15%. India has also seen a significant growth in visitations by 9.0%.
Supply


HVS has noted that, going forward, there will be 15 additional establishments with approximately 2,319 keys in Maldives by 2022, having 11 resorts opened in the first three quarters of 2019.
Maldives Resort Performance 2018 vs. 2019F
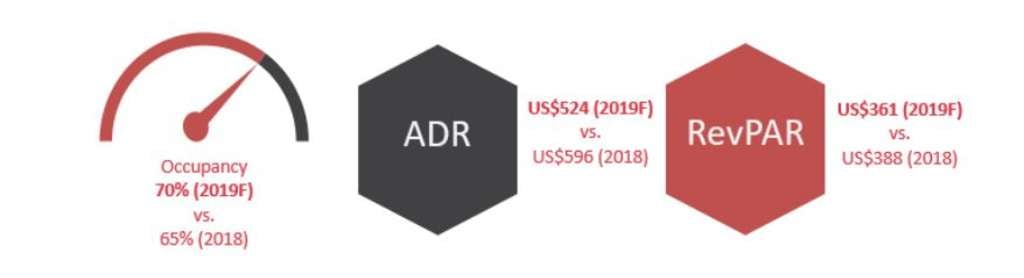
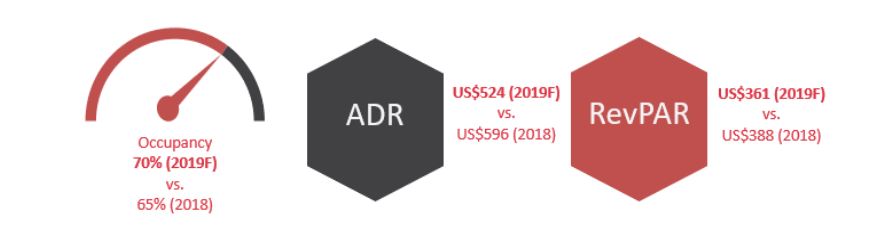
As of YTD August 2019, Maldives saw a 3.7 p.p. increase in occupancy to 68.4% while ADR of US$544 decreased by 13.8% compared to the same period in the preceding year. This is mainly attributed to an increase in midscale hotels being tracked by HVS.
Transactions
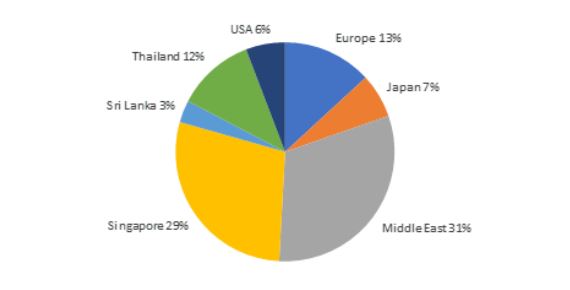
From 2014 to YTD September 2019, Maldives has recorded a total transaction volume of USD692 million. Investors from Middle East and Singapore remain as significant contributors to hotel and resort investments in Maldives. In July 2019, Europe-based Seaside Hotels has ventured into Maldives with an acquisition of the 125-key Bodufaru Beach Resort for a consideration of US$91 million. This transaction accounts for 13% of the total transaction volume from 2014 to YTD September 2019.
Hotel Transaction Volume Recorded by Country (2014 - YTD Sep 2019)


Key Points
- Tourism directly contributes 2.8% to GDP in 2018
- 7.1% Real GDP growth expected in 2019
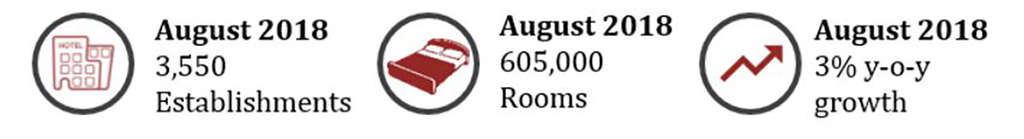
- 3.55 million international tourist arrivals achieved in 2018
Highlights
Infrastructure Projects
- Yangon International Airport upgrade and expansion work, by 2021
- Opening of the Hanthawaddy International Airport, with an initial annual capacity of 12 million, by 2022
New Hotel Openings in Yangon
2020-2022
• Upper Upscale: 6 Hotels, 1,478 keys
• Upscale: 4 Hotels, 895 keys
• Upper Midscale: 3 Hotels, 1,085 keys
• Independents: 2 Hotels, 199 keys
Notable Transactions
- 211-key Inya Lake Hotel located in Yangon was transacted at US$4.7 million (US$22,369/key) in May 2019
- 85-key Hotel G Yangon located in Yangon was transacted at US$1.9 million (US$22,369/key) in May 2019
Demand
In the first half of 2019, Myanmar registered an increase in tourist arrivals, registering a positive y-o-y growth of 33.3%. China overtook neighbouring Thailand as Myanmar's top source market, contributing 35% and 15% of total arrival market share respectively. China has registered a significant y-o-y growth of 140% over the same period in 2018.
Supply

HVS has noted that, going forward, there will be 23 additional hotels with approximately 5,224 keys in Myanmar by 2022.
Myanmar Hotel Performance 2018 vs. 2019F

As of YTD August 2019, Myanmar recorded a positive growth of 3.4 p.p. in occupancy and a decrease of 15.6% in ADR y-o-y. This is possibly attributed to hotels lowering their rates for market penetration as new supply enter the market.
Transactions
There is limited information on hotel transactions in Myanmar, however as of September 2019, there were three recorded transactions in Yangon with an average transaction volume of US$2.4 million. As of July 2019, FDI continues to drop, registering US$62.6 million from April 2018 to March 2019. Investors' uncertainty looms as Western nations remains critical of the treatment of the ethnic-minority Rohingya. According to the Ministry of Hotels and Tourism, Singapore continues to lead the way as one of the biggest investors for Myanmar's hotels and commercial complexes with approximately US$2.7 billion invested into a total of 34 hotels and apartments.
Key Points
- Tourism directly contributes 5.9% to GDP in 2018
- 2.5% Real GDP growth expected in 2019
- 3.8 million international tourist arrivals recorded in 2018
Highights
Infrastructure Projects
- NZ$1.8 billion expansion of Auckland International Airport by 2022
- NZ$4.4 billion City Link Rail in Auckland to be operational by 2024
New Hotel Openings in Auckland
2020-2022
• Luxury: 2 Hotels, 498 keys
• Upper Upscale: 4 Hotels, 988 keys
• Upscale: 3 Hotels, 320 keys
• Upper Midscale: 3 Hotels, 466 keys
• Midscale: 2 Hotels, 187 keys
• Independent: 4 Hotels, 542 keys
Notable Transactions
- 63-key Haka Hotel, located in Auckland, sold for NZ$11.7 million (NZ$185k/key) in May 2019
- 255-key Four Points Sheraton Auckland, located in Auckland, sold for an undisclosed amount in July 2019
- 160-key Adina Hotel Auckland Britomart, located in Auckland, sold for an undisclosed amount in July 2019
Demand
In the first six months of 2019, tourist arrivals amounted to approximately 1.9 million, surpassing last year's arrivals marginally by 1% over the same period. Given its close proximity to New Zealand, tourists from Australia remains as the top source market, accounting for 42% of total arrivals. Arrivals from United States has achieved healthy y-o-y growth of approximately 8.8%, maintaining its position as the third largest source markets. Conversely, China, the second largest source market and United Kingdom, the fourth largest source market, recorded negative y-o-y growths of 6.2% and 0.6%, respectively.
Supply
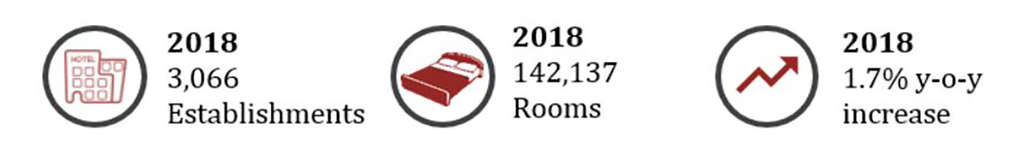

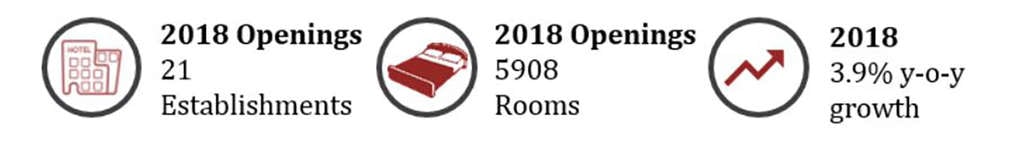
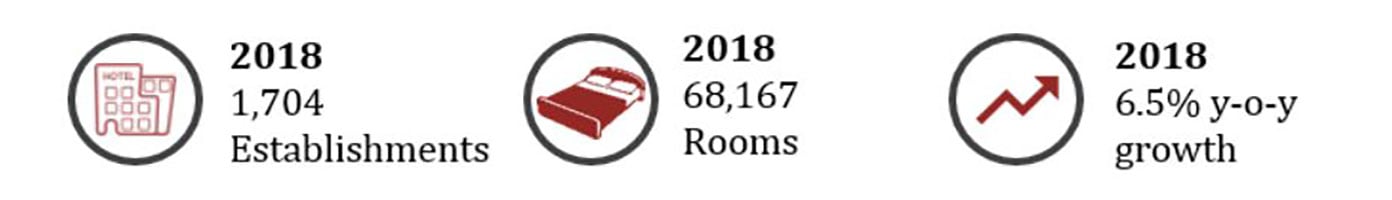
HVS has noted that, going forward, there will be approximately 43 additional establishments with approximately 5,928 keys by 2022.
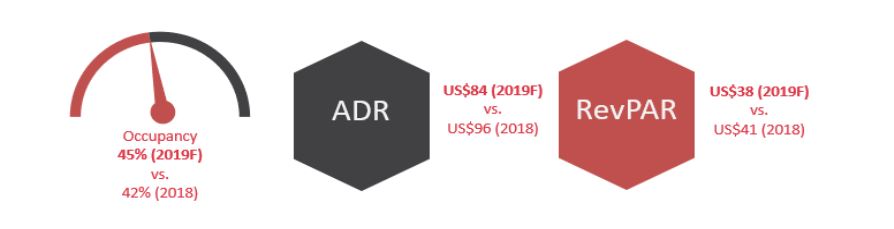
Auckland Hotel Performance 2018 vs. 2019F
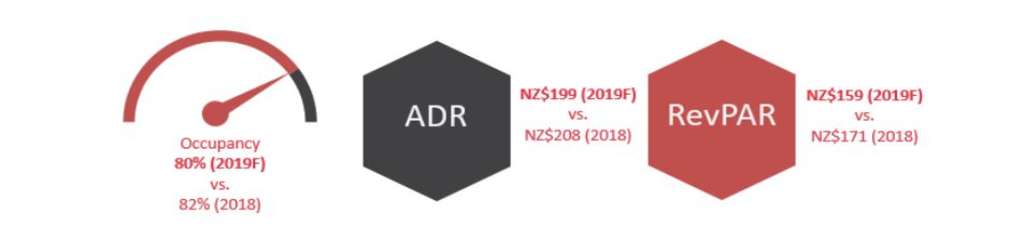

As of YTD August 2019, Auckland recorded a decline of 2.5 p.p. in occupancy and a decrease of 6.5% in ADR y-o-y. This could be attributed to the supply growth rate outpacing the demand growth rate.
Transactions
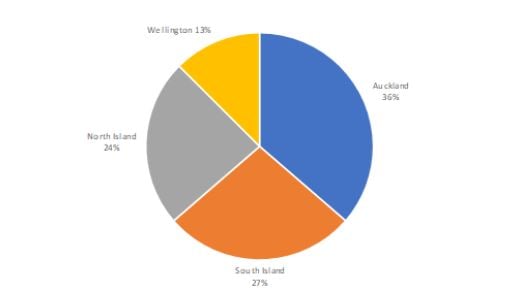
In 2018, the market saw an increase in activity before decreasing in 2019. This is possibly due to the soft hotel performance outlook. Auckland registered the highest share of transaction volume, followed by South Island and North Island. Investors for Auckland properties are mainly dominated by New Zealand buyers.
Hotel Transaction Volume by Market (2014 - YTD Sep 2019)


Key Points
- Tourism directly contributes 12.4% to GDP in 2018
- 6.0% Real GDP growth expected in 2019
- 11.5 million international tourist arrivals achieved in 2018
Highlights
Infrastructure Projects
- Infrastructure development budget of ₱8.4 trillion allocated for 2018-2022
- ₱227 billion Metro Manila Subway Project by 2025, backed by Japan
- ₱4.6 billion Binondo-Intramuros bridge by 2020, backed by China
New Hotel Openings in Manila
2019
• Hotel Okura Manila, 170 keys
• MGallery by Sofitel Manila, 126 keys
2020-2022
• Luxury: 2 Hotels, 666 keys
• Upper Upscale: 4 Hotels, 935 keys
• Upscale: 2 Hotels, 590 keys
• Upper Midscale: 4 Hotels, 1,661 keys
• Midscale: 3 Hotels, 750 keys
• Economy: 2 Hotels, 575 keys
• Independent: 7 Hotels, 2,753 keys
Notable Transactions
- 370-key New World Manila Bay Hotel sold for an undisclosed price in April 2019
Demand
In 2018, arrivals of 7.8 million surpassed the previous year by 8.27%. South Korea consolidates its position as the top source market since 2016 while China overtook United States as the second top source market since 2017. In the first half of 2019, tourist arrivals displayed positive y-o-y growth. Moving forward, the Department of Tourism's refreshed "It's More Fun in the Philippines" tourism campaign seeks to position Philippines as a pioneering destination for sustainable tourism and continue its demand growth trajectory.
Supply
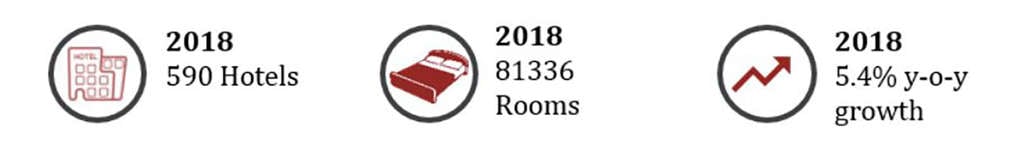

HVS has noted that, going forward, there will be 63 additional hotels of approximately 16,542 keys in the Philippines by 2022, with eleven hotels opened in the first three quarters of 2019.
Metro Manila Hotel Performance 2018 vs. 2019F
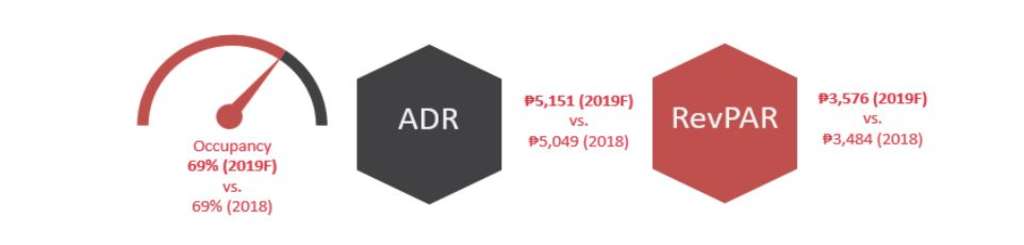

As of YTD August 2019, Manila recorded a marginal y-o-y decline in occupancy by 0.1 p.p. whereas ADR grew by 1.4%.
Transactions
As of YTD September 2019, we noted two hotel acquisitions by Hong Kong-based International Entertainment Corporation; the 370-key New World Manila Bay Hotel and an unnamed hotel. Both deals were transacted at an undisclosed amount. For the past five years, all transactions in Manila were local real estate operating companies such as Frontier Capital Group and Shang Properties Inc. The lack of hotel transaction in the past few years could be due to the domination of local players and the lack of opportunistic investment.

Key Points
- Tourism directly contributes 4.0% to GDP in 2018
- 0.9% Real GDP growth expected in 2019
- 18.5 million international tourist arrivals recorded in 2018
Highlights
Infrastructure Projects
- Addition of Changi Airport Terminal 5 by 2030
- Rejuvenation of Orchard Road
- Development of the Mandai eco-tourism hub by 2023 and tourism hub in Jurong Lake District by 2026, as well as the Greater Southern Waterfront and Sentosa Island
- Expected completion of the Thomson-East Coast line by 2024
New Hotel Openings in Singapore
2019
• Citadines Rochor, 320 keys
2020-2022
• Luxury: 2 Hotels, 251 keys
• Upper Upscale: 2 Hotels, 558 keys
• Upscale: 1 Hotel, 299 keys
• Upper Midscale: 3 Hotels, 888 keys
Notable Transactions
- 146-key Ascott Raffles Place Singapore sold for S$353 million (S$2.4m/key) in May 2019
- 319-key Bay Hotel Singapore sold for S$235 million (S$736k/key) in August 2019
- 25% stake in 575-key Marina Mandarin transacted for S$190 million (S$330k/key) in April 2019
Demand
In the first half of 2019, tourist arrivals recorded robust y-o-y growth. YTD June 2019 arrivals of 9.3 million surpassed last year's arrivals by 1.3%. China continues to be the top source market, accounting for 19% of total tourist arrivals. This is followed by Indonesia and India at 16% and 8% respectively. In 2018, Singapore Tourism Board announced a three-year partnership with Cruise Lines International Association (CLIA) and a three-year tripartite partnership with Costa Cruises to enhance Singapore as a cruise destination. In April 2019, Changi Jewel officially opened its doors to the world, enhancing travel experience for travellers.
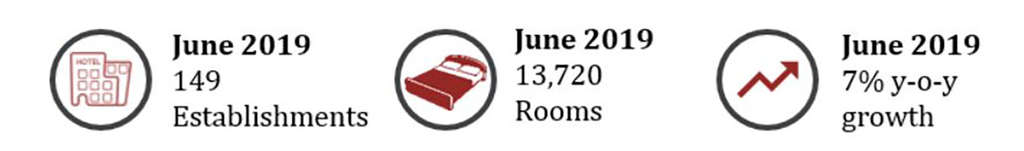
Supply
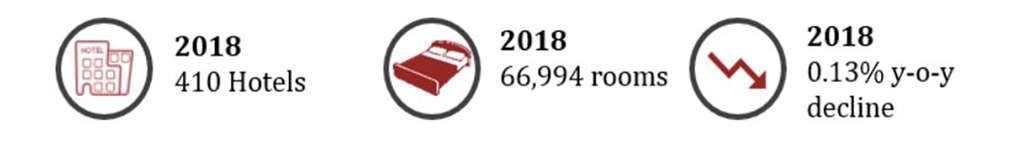

HVS has noted that, going forward, there will be nine additional hotels with 2,316 keys in Singapore by 2022, with 12 hotels opened in the first three quarters of 2019.
Singapore Hotel Performance 2018 vs. 2019F
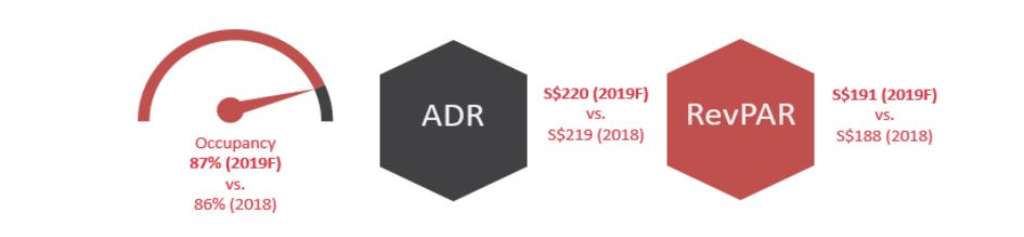
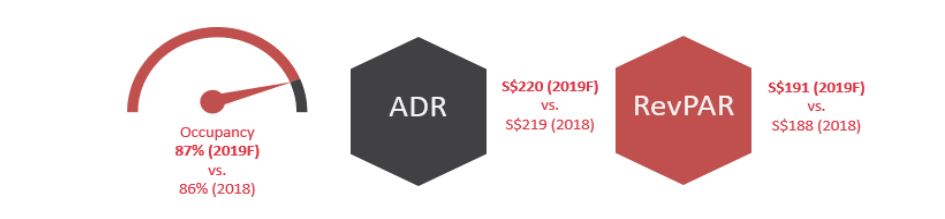
As of YTD August 2019, Singapore observed a y-o-y increase in market occupancy by 0.5 p.p. while room rate decrease by 0.3%. Hotel outlook in Singapore remain optimistic with occupancy and room rates recorded positive growths across all hotel tiers except for luxury tier which recorded a slight decrease in occupancy of 0.7%.
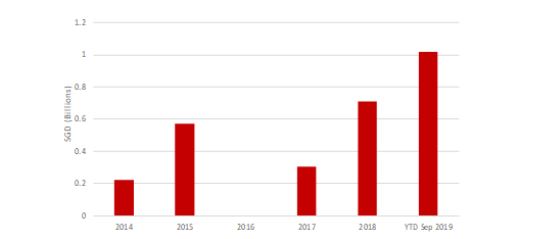
Transactions
Ever since the bottoming in 2016, transaction volume has picked up significantly. As at September 2019, although only five hotels were transacted, it recorded a transaction volume totaling S$1,017 million, surpassing the value in 2018 by 44%. Generally, Singapore's hotel investment market has been dominated by local investors.
Transaction Volume by Year (2014 - YTD Sep 2019)


Key Points
- Tourism directly contributes 5.7% to GDP in 2018
- 2.7% Real GDP growth expected in 2019
- 2.3 million international tourist arrivals recorded in 2018
Highlights
Infrastructure Projects
- Infrastructure development is a priority for the government
- Several projects have been announced including the additional terminal at Colombo airport, highways, expressways and elevated road network, rehabilitation of coastal road network etc
New Hotel Openings in Colombo
2019
• Sheraton Colombo, 320 keys
2020-2022
• Luxury: 2,764 keys
• Upper Upscale: 700 keys
• Upscale: 200 keys
• Budget: 600 keys
Notable Transactions
- 198-key Marriott Weligama Bay Resort & Spa transacted at US$22.62 million in April 2019
- 35-key Tangalle Bay Hotel transacted at LKR385 million in August 2018
Demand
Tourist arrivals to Sri Lanka have declined significantly as an aftermath to the Easter Sunday terrorist attacks in 2019. In the first eight months of 2019, tourist arrivals declined to 1.2 million compared to 1.5 million during the same period in 2018, registering a year-on-year (y-o-y) decline of 19.9%. India, UK and China are the top three source markets, with a market share of 16.7%, 11.4% and 9%, respectively, as of year-to-date (YTD) August 2019. The Government has exempted mandatory visa fee for tourists from 48 countries for six months starting August 2019 to revive tourist arrivals.
Supply

HVS research indicates that Colombo has a pipeline of 14 additional hotels with 4,264 rooms expected to be opened by 2022.
Colombo Hotel Performance 2018 vs. 2019F
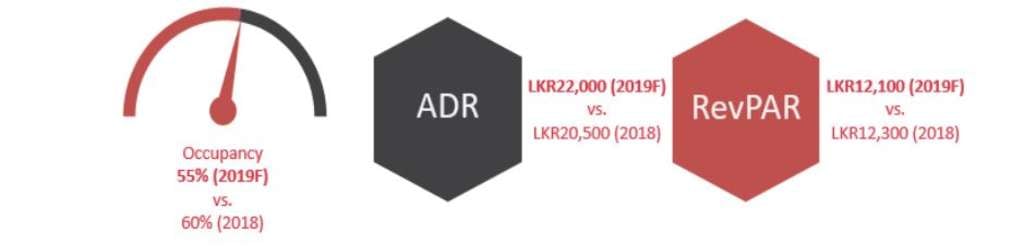
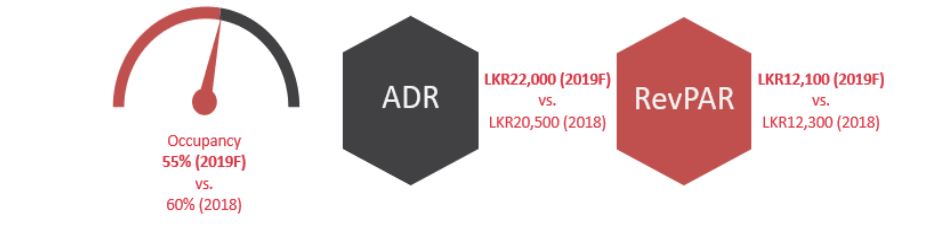
Occupancy has declined significantly since the April 2019 attacks. Reports indicate that occupancy in Colombo declined by almost 29% YTD August 2019 compared to previous year.
Transactions
Only three hotel transactions have been recorded in Sri Lanka in the last five years. Singapore-based Hotel Properties Ltd (HPL) has announced two acquisitions in the last two years. The company acquired Tangalle Bay Hotel in 2018 for LKR385 million. More recently in April 2019, HPL entered into a Share Purchase Agreement to acquire Weligama Hotel Properties Limited, which owns the 198-key 5-Star Resort, Marriott Weligama Bay Resort & Spa.


Key Points
- Tourism directly contributes 6.0% to GDP in 2018
- 7.0% Real GDP growth expected in 2019
- 15.5 million international tourist arrivals recorded in 2018
Highlights
Infrastructure Projects
- Opening of Metro Line 2A in Hanoi by 2023
- Opening of Metro Lines 1 and 2 in HCMC by 2021 and 2026 respectively
- Renovation project of 16 of the 21 civilian airports in Vietnam, including HCMC and Hanoi airports, for a total of ₫56.7 trillion
New Hotel Openings in Hanoi and HCMC
2019 (Top Three Largest Inventory)
• Novotel Hanoi Thai Ha, 343 keys
• Somerset D1Mension, 198 keys
• PentStudio West Lake Hanoi, 151 keys
2020-2022
• Luxury: 2 Hotels, 327 keys
• Upper Upscale: 4 Hotels, 924 keys
• Upscale: 5 Hotels, 1,079 keys
• Upper Midscale: 5 Hotels, 1,037 keys
• Independent: 1 Hotel, 200 keys
Notable Transactions
- 75% interest in 318-key InterContinental Hanoi West Lake Hotel transacted for ₫1.2 trillion (₫3.9bn/key) in May 2019
- 70% interest in 118-key Long Beach Resort Phu Quoc sold for ₫0.3 trillion (₫2.8bn/key) in June 2019
Demand
In the first half of 2019, tourist arrivals exhibited consistent y-o-y growth. YTD July international arrivals of 9.8 million outstripped last year's arrivals by 7.9%. China remains as Vietnam's top source market, accounting for 33% of total international tourist arrivals in 2018. South Korea, a fast growing source market for Vietnam, has recorded a robust y-o-y increase of approximately 44% in 2018.
Supply
HVS has noted that there will be 114 additional hotels with approximately 42,456 keys by 2022, having 18 hotels opened in the first three quarters of 2019.
Hanoi and Ho Chi Minh City (HCMC) Hotel Performance 2018 vs. 2019F
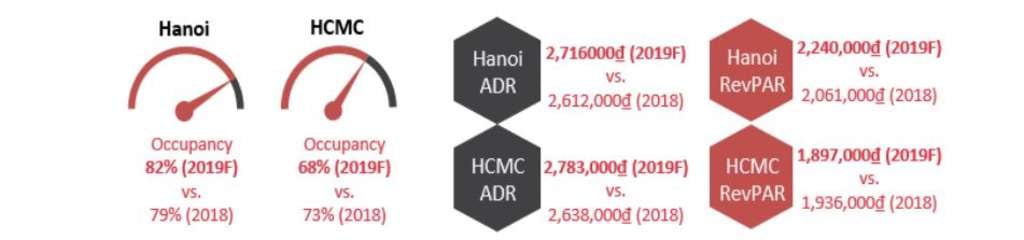
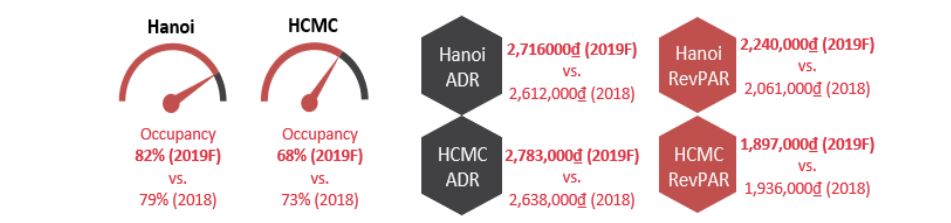
As at YTD August 2019, HCMC hotel market recorded a y-o-y decline in hotel occupancy by 5.3 p.p. and an increase in ADR by 6.2%. The decline in occupancy is mainly due to increasing supply of residential apartments competing for the demand in extended-stay. Hanoi hotel market recorded growths in occupancy and ADR by 3.9 p.p. and 6.0%, respectively.
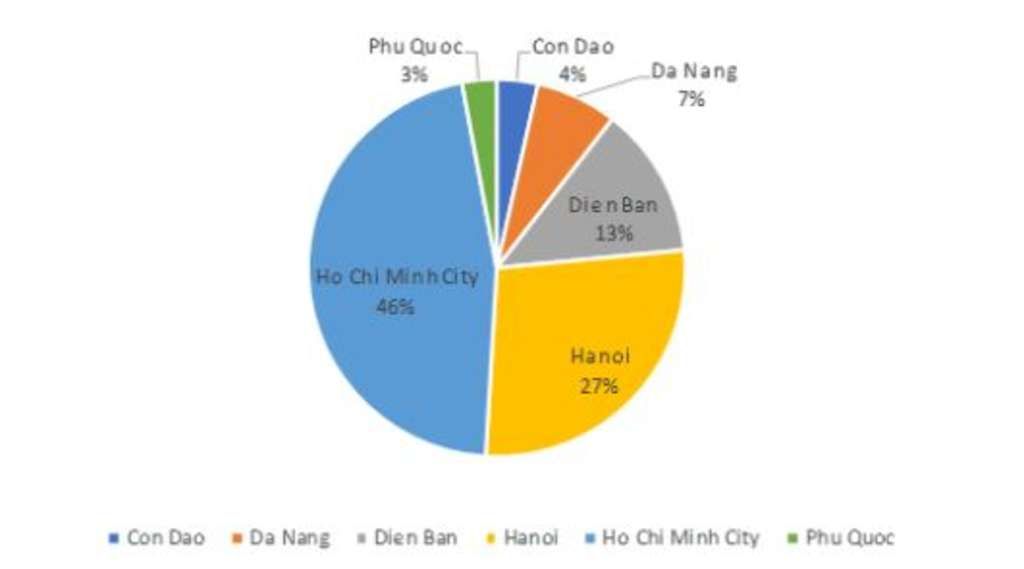
Transactions
From 2014 to YTD September 2019, 46% of the recorded transactions in Vietnam occurred in HCMC. Hanoi accounted for 27% of recorded transactions, followed closely by Da Nang. In June 2019, Phu Quoc recorded the sale of partial interest of the 118-key Long Beach Resort for ₫0.3 trillion. Moving forward, there remain opportunities for investment transactions in Vietnam, especially with the new wave of branded properties entering the market such as JW Marriott Danang Resort and Movenpick Resort Cam Ranh.
Transaction Volume by Location (2014 - YTD Sep 2019)

Notable contributions were made by Chee Hok Yean, Mandeep S. Lamba, Ho Mei Leng, Akash Datta, Dipti Mohan, Jeremy Teo, Kok Xin, Cindy Lim and Peggy Lee.