How Online Hotel Distribution Is Changing In Europe
A Deep-dive into European Hotel Distribution trends 2014-2018
The hotel distribution landscape is often touted as a duopoly held by Booking and Expedia, but we see it slightly differently. While they do command a sizeable part of the market share, there are actually other channels that hoteliers are leveraging successfully.
After hundreds of hours analyzing the last five years of hotel distribution across a selection of our client base, we have produced a report to shed some light on how distribution has evolved and, hopefully, give some inspiration to hoteliers to optimizing it.
TEN KEY FACTS
- Online Distribution has grown by 46.7% between 2014 and 2018
- 71% of online distribution for independent hotels is generated by online travel agencies in 2018
- Booking Holdings holds 68% of the OTA market share in 2018
- Wholesalers and bed banks have grown by over 100% in 5 years
- Website Direct remains the second most important sales channel, with 20.9% of market share
- While still the second best channel, Website Direct has lost 6.3% share in 5 years, which has been taken over by OTAs
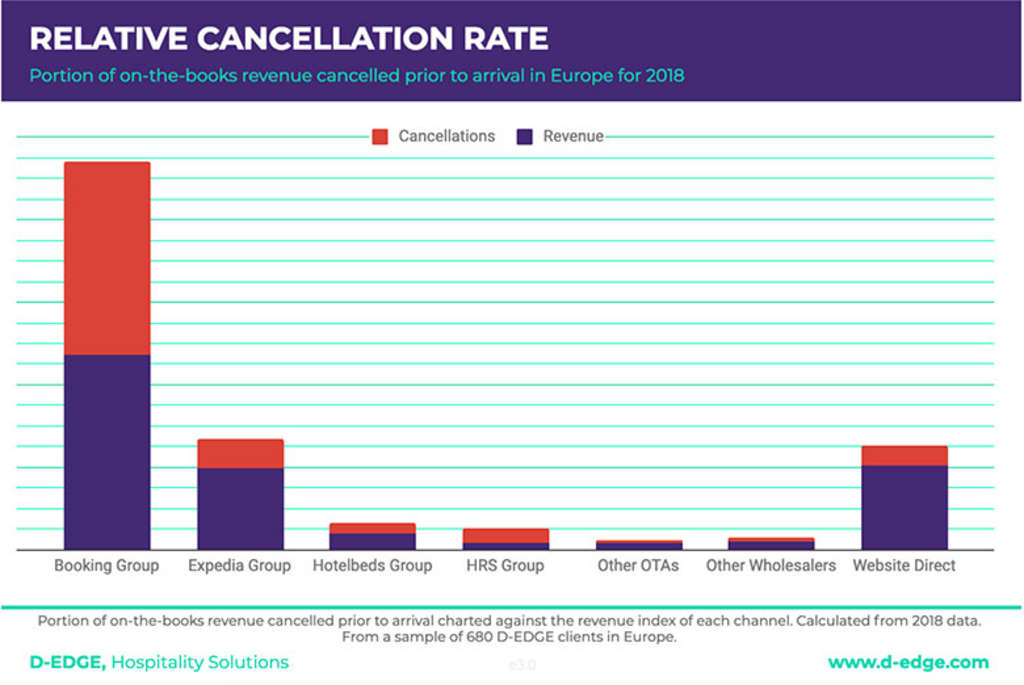
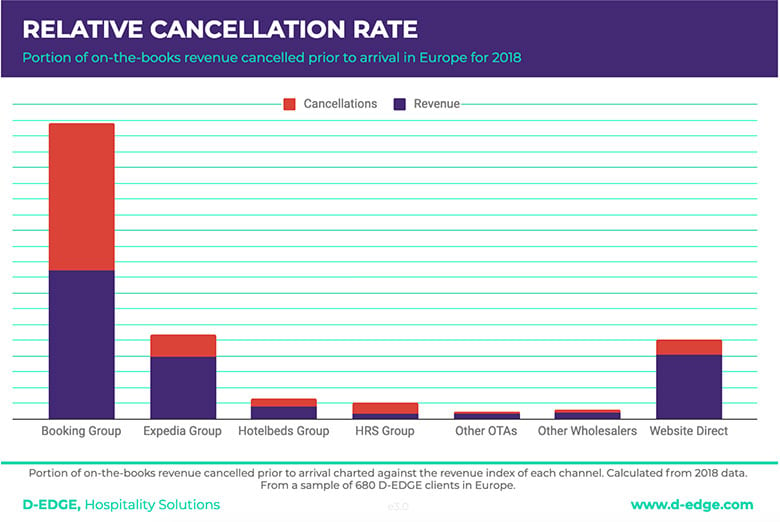
- Almost 40% of on-the-books revenue is canceled before arrival in 2018
- Average Length-of-Stay has diminished by 12%
- After 4 years of negative trend, in 2018 the industry experienced an improvement in both length-of-stay and reservation value
- Reservations with lead times longer than 60 days are 65% more likely to be canceled
METHODOLOGY
"We evaluated the online distribution of over 200 different distribution channels and 680 hotel properties in Europe. The data were aggregated from D-EDGE Booking Engine and Channel Manager on a panel of 680 hotels, consistent from 2014 to 2018. Our observation was contained to the hotels that had enough volume to keep this report statistically relevant."
MARKET SHARE REMAINS RELATIVELY STABLE
The market share distribution channels has remained relatively stable, however, trends are showing that both OTAs (especially Booking Holdings' distribution channels) and wholesalers grew, while more channels with lower costs per client acquisition (such as Direct) lost share. In 2018, eventually, this negative trend started to reverse, with Direct regaining 1.6 percentage points over the previous year. The trend is somehow reassuring, even though the results are lower than what they were back in 2014, with a 23,2% decrease in market share.
OUR CONCLUSION
In the current market situation, hotels seem more focused on channel optimization, as is evident in 2018's distribution mix. While almost all channels increased in revenue over the period analyzed, Website Direct had an important shift in 2018 where it regained market share for the first time in five years.
OUR ADVICE
Even though there is undeniable value in focusing on more profitable channels, we recommend reviewing the market share at least quarterly, in order to avoid some channel(s) cannibalizing the others and keeping a healthy and profitable distribution mix.
THE DISTRIBUTION REVENUE INDEX
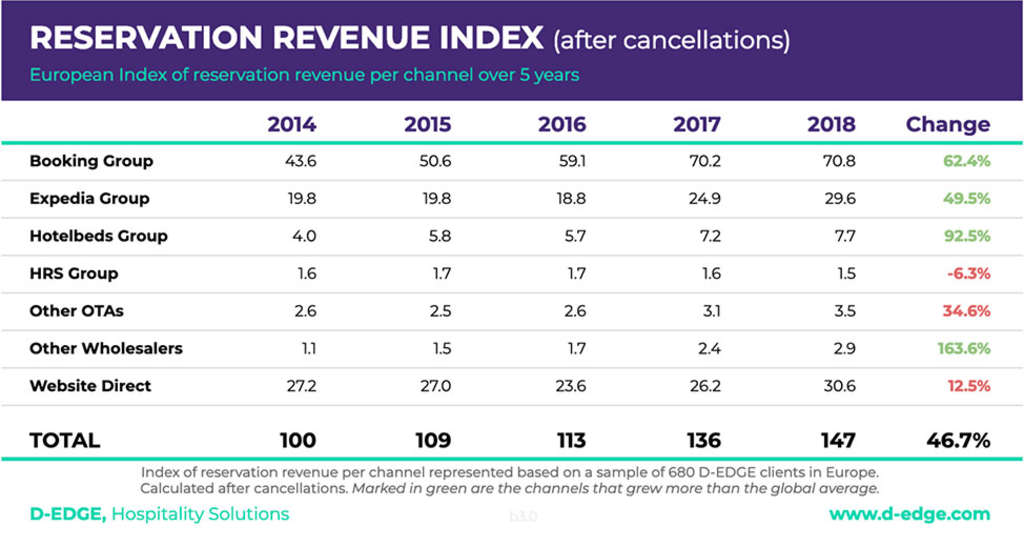
To illustrate the change in growth of the multiple channels we have made an index based on the revenue generated from each one of them. The general growth of online distribution reached 46.7%. The increase came primarily from the two principal OTAs, which have grown faster than the average. A similar trend can be observed with wholesalers, even though they represent a much smaller relative volume. In the next chart, we have marked (in red) the channels that grew slower than the general market. In general, 2017 was the best year with a considerable increase of 20% YoY. This positive trend continued in 2018 but, with just 8% growth, as mentioned previously, it is plausible to assume hotels may have begun channeling the revenue towards more profitable channels.
OUR CONCLUSION
Except for the statistical exceptionality of 2017, the growth rate has equalized to an average of 8% YoY, which we believe will continue in the years to come.
OUR ADVICE
Hotels should analyze the growth rate of their respective channels and look at which one(s) are generating incremental revenue. Make sure those are optimized with high quality and up-to-date visuals, room inventory availability and rates. Ensure that B2C prices are not being undercut by OTAs, wholesalers, resellers and bed banks, as this disparity will likely hurt overall growth.
ADDITIONAL INFORMATION
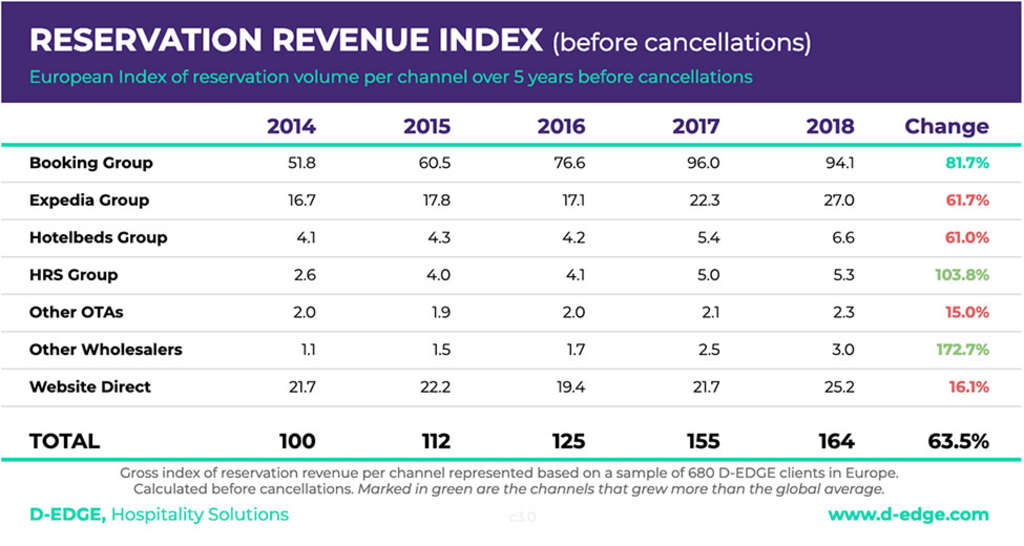
While this analysis is based on revenue generated after cancellations have been removed, we have included the index before cancellations as a comparison. We cover this topic in more detail in the Cancellation section below.
CANCELLATIONS, A GROWING PROBLEM
With the exception of 2018, every single channel has observed a marked increase in cancellation rate YoY. And, even in 2018, the number was 7.1 points above 2014. With a global average of almost 40% cancellation rate, this trend produces a very negative impact on hotel revenue and distribution management strategies. Website Direct has kept the lowest cancellation rate of all channels, though it too increased by 2.8 points.
OUR CONCLUSION
Guests have become accustomed to free cancellation policies that have been made popular (and encouraged) by mainly Booking.com and channels and apps such as Tingo or Service, designed to cancel and rebook hotel rooms at each rate drop.
This customer behavior hinders accurate forecasting, eventually resulting in non-optimized occupancy. Other factors come into play with cancellation rate increased but we believe none are as pervasive as the increased behaviour and marketing of "Free Cancellations".
OUR ADVICE
Other than factoring the cancellation rates and understanding the fluctuations per season and per channel, we advise hotels to ensure they use channel management tools with a robust two-way connection, so that canceled inventory can be fed back and re-distributed across all channels in real-time. Favoring not-refundable rates over flexible ones, or implementing more rigid cancellation policies can also help to limit the issue.
ADDITIONAL INFORMATION
While it is true that Booking Holdings' distribution channels have one of the highest cancellation rates, it is also true that it continues to out-perform all other channels. Further analysing the data we discovered that the average length of stay of canceled reservations is higher than by a striking 65%, with a lead time of 60 days.
Our data shows that larger reservations with longer lead times have a higher likelihood of getting canceled, and this additional information could help revenue managers predict what kind of reservations (and when) are more likely to be canceled.
LEAD TIME, MONITORING THE GAP BETWEEN CHANNELS
Lead time and pick-up pace have always played a crucial role in the correct application of hotel revenue management strategies. As a general rule, in fact, lead time is directly proportional to the level of forecasting accuracy.
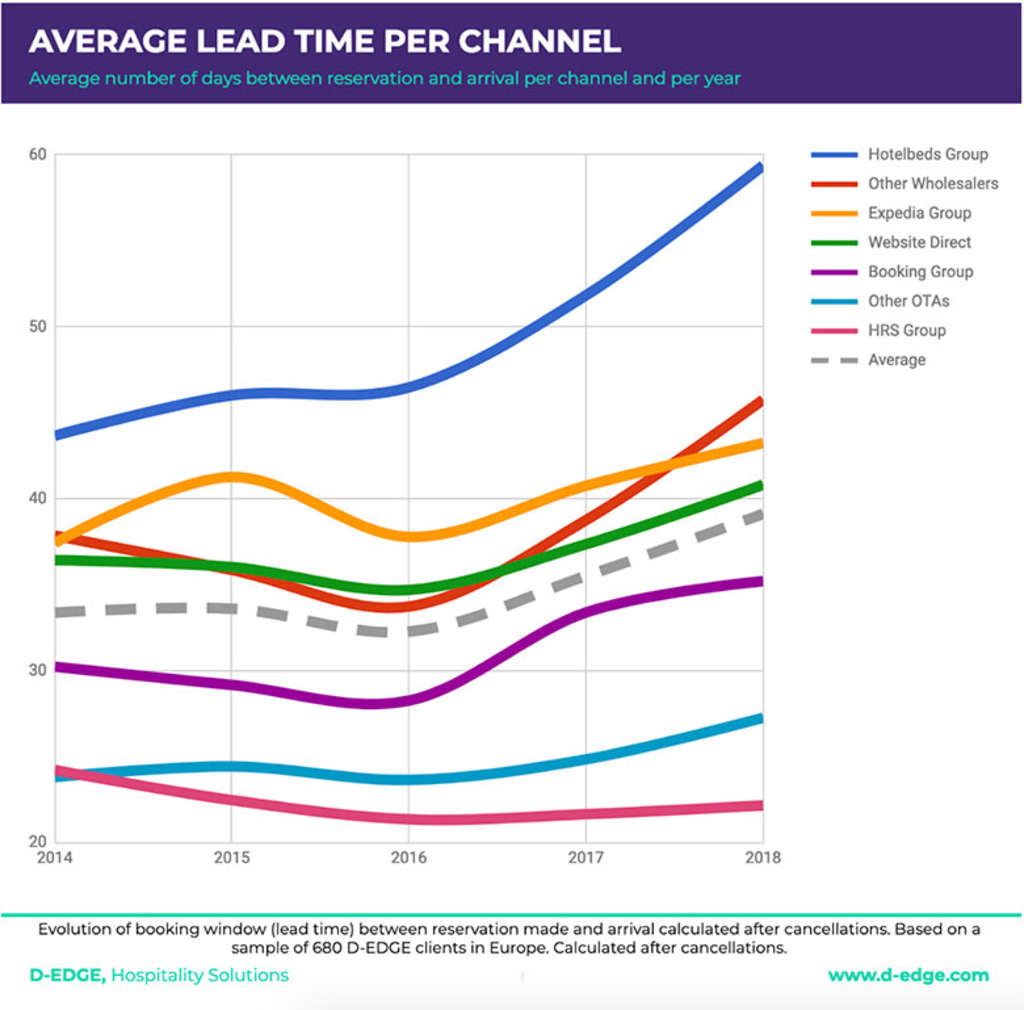
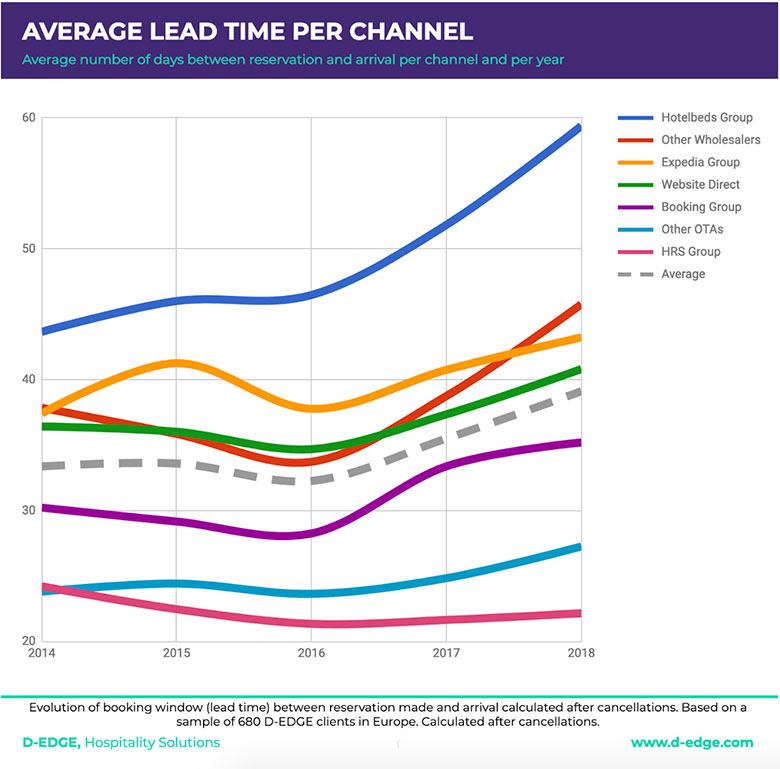
Surprisingly, we found that the average lead time (after cancellations) increased by 17% over the last five years, channels such as HotelBeds have been leading the way with 59.6 days of lead time, an increase of 36% compared to 2014.
OUR CONCLUSION
Different channels have shifted their average lead time in different ways over the years: if five years ago we observed clusters of channels with similar booking windows, with the gap between HotelBeds and HRS being of 19.4 days, data from 2018 show a separation per channel that is more evident, with a difference between the two channels of 37.2 days.
OUR ADVICE
Hotels should put advanced nesting strategies in place, in order to allocate the right inventory to the right channel at the right time. By understanding the characteristic features of each platform, revenue managers can avoid room spoilage and spillage, maximizing the hotel revenue, minimizing the risks and forecasting with a greater level of accuracy.
AVERAGE RESERVATION VALUE IS WORTH MONITORING
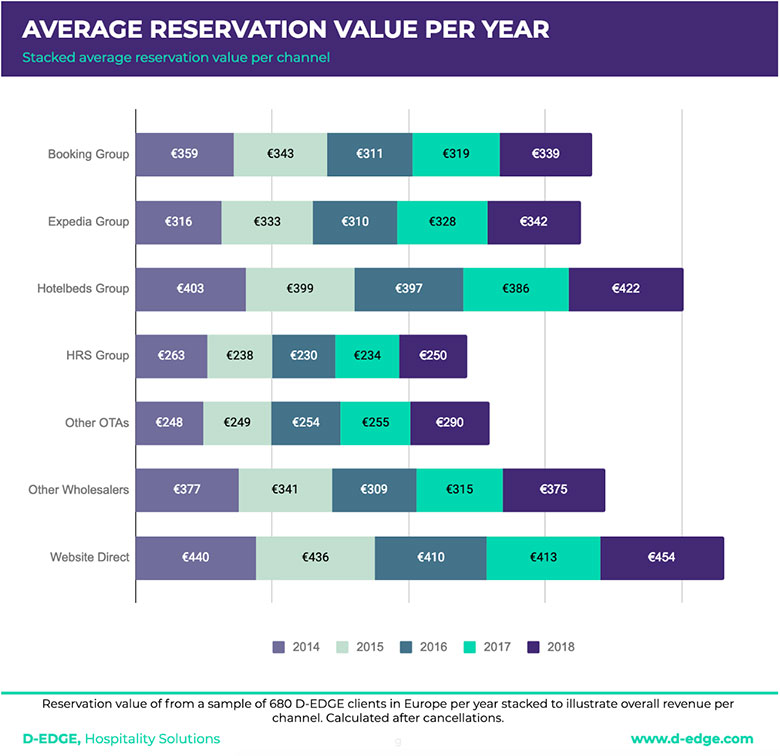
In general, the reservation value increased by 9%, but while some distributors produce more volume than others, it is intriguing to observe how some also generate more value per transaction and how this value evolved over time. Booking Holdings' channels and HRS reservation value, for example, shrank by €20.00 and €13.00 respectively, while HotelBeds and the Expedia Group grew by €19.00 and €26.00 (change from merchant model to agency model undoubtedly played a role in increasing this). Website Direct experienced an increase in reservation value as well, with a €14.00 increase.
OUR CONCLUSION
Even in the current highly competitive market, the average hotel reservation value increased by €9.00. Which is in line with the data presented in the latest STR and PwC "European cities hotel forecast" report (€236.00 in 2018). However, not all channels experienced the same positive trend.
OUR ADVICE
Monitoring the average reservation value of each channel is a key factor when it comes to rooms and rates allocation. Focusing on revenue volume alone can be misleading and create a counterproductive cognitive bias, eventually mining one's profit.
LENGTH OF STAY, SLOWLY BUT STEADILY, TRAVELERS HABITS ARE CHANGING
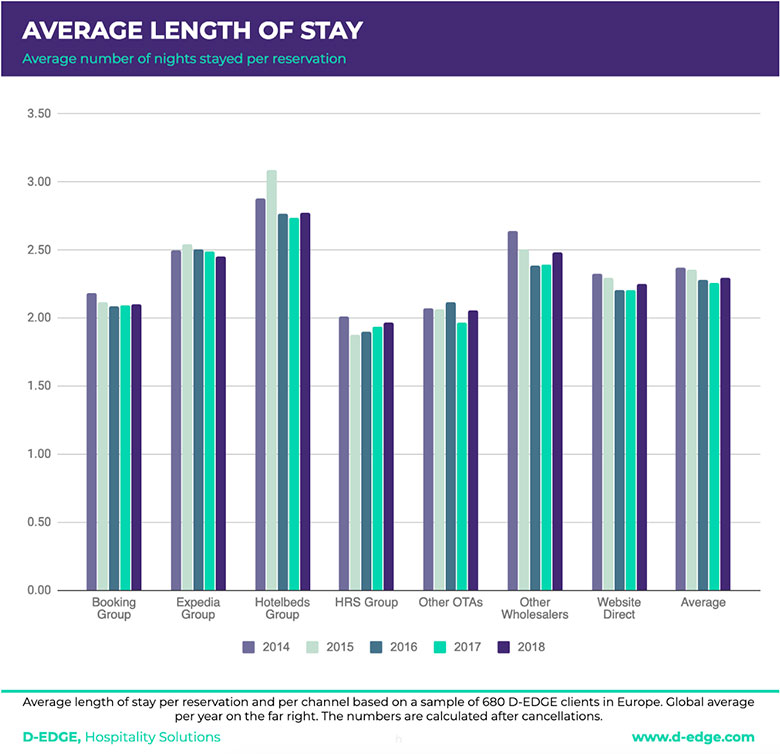
While slowly recovering in 2018, average Length of Stay (LoS) shrank, over the years, going from 2.37 days in 2014 to 2.26 in 2017 and up again to 2.3 in 2018. However, LoS steadily decreased on every single channel, with minimal differences between them. Again, at the two ends of the spectrum there are HotelBeds and HRS with, respectively, 2.77 and 1.97 days of average stay in 2018.
OUR CONCLUSION
Different types of hotels have, different LoS as well: some business hotels and most resorts are privileged with longer stays than city-break hotels, for example, but the aggregated data provides a compelling indication of how travel habits are changing on all segments.
OUR ADVICE
The notion of LoS is closely related to reservation value: longer stays mean reduced operational costs (E.g: laundry, housekeeping, etc.) and increased possibilities of up and cross-selling. Choosing the channels with the longer LoS can help maximizing profit and optimize room allocation.
FINAL TAKE-AWAYS
Based on the data analyzed, it is evident that Booking Holdings and the Expedia Group control the lion's share of the hotel distribution landscape. Furthermore, we are not likely to see a reversal or even an adjustment to this trend in the foreseeable future. And, if and when it will happen, it would probably be because of new players with different business models such as Google or Airbnb (or even Amazon) disrupting the industry, rather than new online travel agencies, wholesalers and bedbanks.
The 2018 positive trend of Website Direct revenue is encouraging, and with further adoption of frictionless, facilitated booking methods (such as Book-on-Google) and the right technology partners we see this trend continuing.
Nevertheless, hotels should always keep diversifying their risk, either by adding consortia agreements, empty-for-full wholesalers deals, GDS, coupon sites or niche, highly-specific OTAs.
As a hotel technology company we would advise hotels to ensure they chose robust and large distribution providers that can facilitate access to new distribution platforms who will inevitably work with the larger providers first.
Regularly looking into the various channels can help optimize distribution and improve forecasting by prioritizing certain rates, opening other channels or changing restrictions. This is why we are continuously analyzing travelers' behavior, to offer relevant alternatives to all those hotels looking to increase their revenue and create a robust, more balanced and profitable distribution mix.
About D-EDGE
D-EDGE is a SaaS company offering leading-edge cloud-based e-commerce solutions to more than 17,000 hotels in over 150 countries. Combining technical excellence with digital marketing expertise, D-EDGE brings a holistic hospitality technology infrastructure under one roof. The integrated range of solutions covers all stages of hotel distribution which encompasses Central Reservation System, Guest Management, Data Intelligence, Connectivity Hub, Digital Media, and Website Creation. With a team of 500 experts located in over 25 countries, D-EDGE provides localised support, services, and tools. With its global network of 550+partners, D-EDGE’s ever-expanding ecosystem is a positive place to do business and grow. D-EDGE is a subsidiary of Accor, a world-leading hospitality group consisting of more than 5,300 properties and 10,000 food and beverage venues throughout 110 countries. For more information visit www.d-edge.com.


