Market Recovery Monitor - 2 April 2022

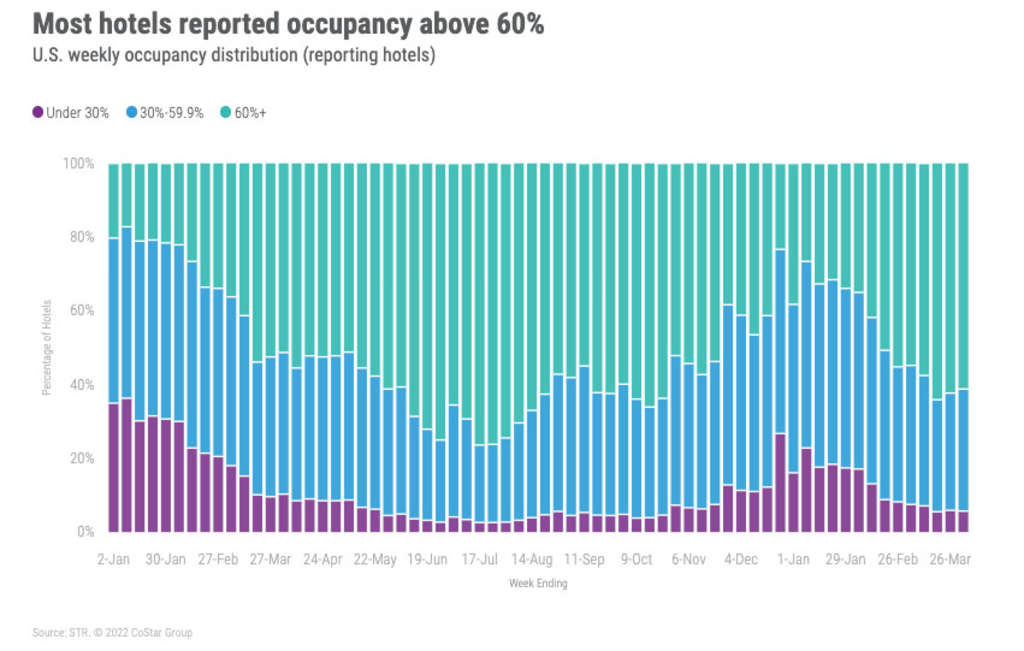
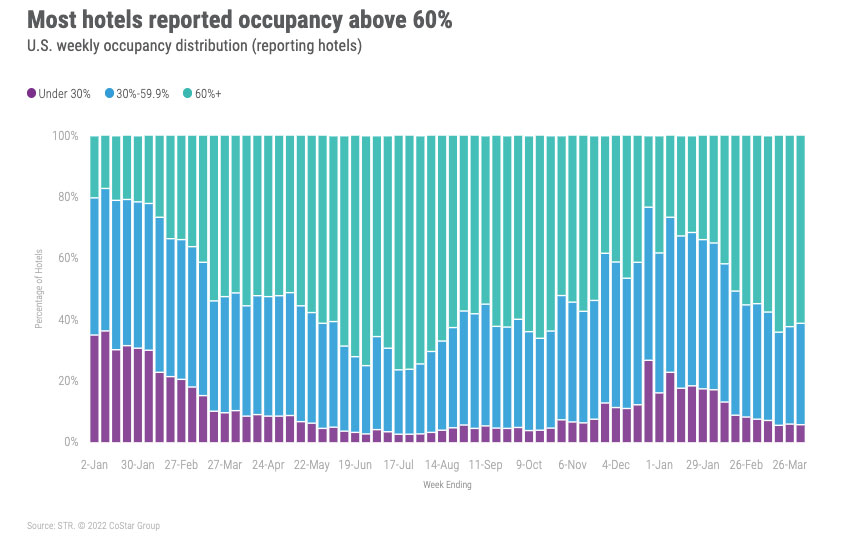
During the week ending 2 April, U.S. hotel occupancy (64.2%) slipped for a second consecutive week, dropping 1.4 percentage points from the prior week. The decrease was not a surprise given that Spring Break is winding down. While weekly occupancy has been above 60% for six consecutive weeks, the most since summer 2021, it has averaged 4.4 percentage points lower than what it was in the comparable six weeks of 2019. Average daily rate (ADR) declined for a second consecutive week to US$146 – the fourth-highest level in the metric on record. Revenue per available room (RevPAR) decreased to US$94 after reaching a pandemic-era high (US$101) two weeks prior.
Among the 166 STR-defined markets, eight saw weekly occupancy surpass 80%. All but one of those markets were in Florida, and the Florida Keys (85%) had the nation’s highest occupancy as it has during 12 of the past 14 weeks. Two weeks ago, during the peak of the spring break travel season, 21 markets saw occupancy above 80%. Even as occupancy tempers down, 46 markets reported levels higher than the comparable week of 2019.
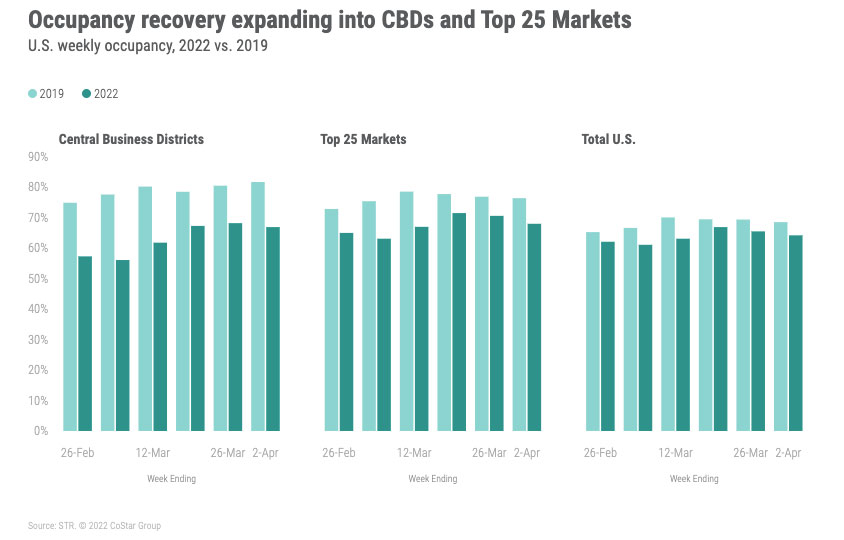
Occupancy in the Top 25 Markets fell 2.5 percentage points week over week to 68% but two markets reported their highest weekly occupancy since the start of the pandemic: Washington, D.C. (66.6%) and Nashville (78%). Atlanta also saw its second-highest occupancy of the pandemic-era (72.2%). The decline in overall Top 25 Market occupancy was across all day types, with the weekend (Friday & Saturday) seeing the smallest decrease (-1.8 percentage points).
Orlando, the nation’s second-largest market based on room supply, continued to see strong occupancy (75.4%), albeit down from the prior week. Orlando’s occupancy has been above 70% in seven of the past eight weeks, reaching a pandemic-era high two weeks earlier. To put it into context, in 2019, occupancy in the market was above 70% in 13 of the past 14 weeks, with the spring break weeks coming in above 80%.
Central Business Districts (CBDs) saw a 1.3 percentage point decline week on week (to 67%). Despite the decrease, CBDs saw their third-highest occupancy level since March 2020. Recall, the CBD pandemic-era high was achieved a week ago (68.2%). Three CBDs, Atlanta CBD (74.9%), Nashville CBD (86.2%), and Washington, D.C. CBD (70.5%), saw their highest occupancy since the start of the pandemic. The Atlanta CBD and Nashville CBD had their highest weekday (Monday-Wednesday) occupancy of the pandemic-era.

Weekday group demand among luxury and upper upscale hotels was mostly flat over the previous week, but above levels seen last year. The largest weekday market gains were seen in Atlanta and Nashville, with Orlando and San Francisco posting this week’s largest group declines.
After a slow start at the beginning of the year, the industry resumed its recovery during the week of the President’s Day holiday. Looking at the past six weeks, demand was down 5 million room nights from the comparable six weeks 2019. Revenues, however, were up US$1.4 billion, and slightly down when adjusting for inflation. To better understand the industry’s performance during the spring travel season, we grouped the 166 STR-defined markets into seven groups, beginning with the Top 25 Markets. The remaining markets were grouped based on their occupancy for the six weeks ending 6 April 2019. Each group contained 25 markets, with the final group made up of 16 markets.
Not surprising, the largest gap in performance for the six weeks ending 2 April 2022 to the comparable six weeks in 2019 was in the Top 25 Markets. Of the 5.2 million room night deficit to 2019, 4.8 million came from the Top 25. Within the Top 25, 76% of the room night decrease was from weekday demand, mostly from large hotels (300+ rooms). Not surprising, the decline was centered on group, which accounted for most of the demand deficit in the Top 25 Markets. More than 50% of the weekday room demand decrease came from five markets (Washington, D.C.; New York, Chicago, San Francisco, and Los Angeles), led by Washington, D.C., and New York, which combined accounted for 28% of the demand deficit over the past six weeks.
Among the two lowest 2019 occupancy market groups, both saw higher demand in the past six weeks over 2019. The demand growth over the past six weekends was the highest of the seven market groups examined.
Weekly ADR fell 2.4%, its second consecutive weekly fall but remained well above the comparable 2019 level (+12%). Adjusting for inflation, weekly ADR was flat to 2019. Weekday and shoulder (Sunday & Thursday) ADR declined 3.1% week over week, whereas weekend ADR fell 1.3%. ADR in the Top 25 Markets dropped 1.4%, with all others markets combined decreasing 2.9%. Weekend ADR in the Top 25 Markets remained relatively strong with little change (+0.6%) as the remaining markets fell (-2.4%). On the positive side, CBDs saw their highest weekly ADR (US$224) since the start of the pandemic, up 3.6%.
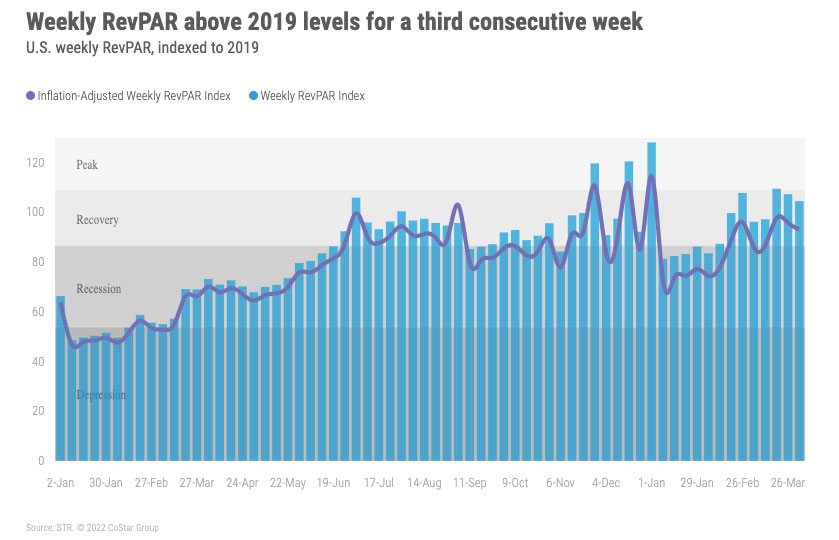
For the past three weeks, industry RevPAR has been above what was achieved in 2019. Weekly RevPAR was 5% higher than the 2019. Real (inflation-adjusted) RevPAR, however, was 7% lower than 2019. Top 25 Market RevPAR decreased 5% week on week, led by a 6% decrease on weekday and shoulder days. All other markets saw RevPAR drop 4.1%. CBD RevPAR (US$150) was the highest of the pandemic-era, up 1.7% week over week, but 13% lower than in 2019.
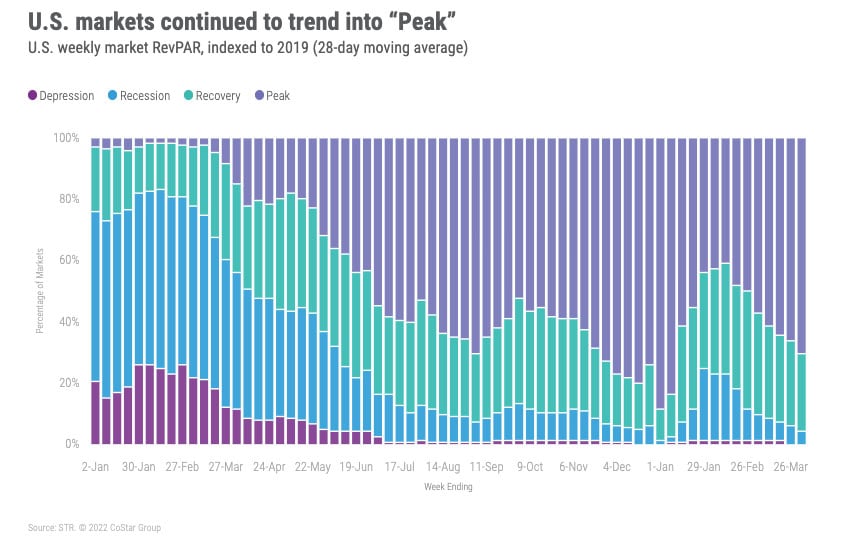
Over the past week, 65% (40% when adjusting for inflation) of markets reported RevPAR that was higher than what it was in 2019. The number of markets at “peak” RevPAR (RevPAR indexed to 2019 above 100) has been elevated for the past three weeks. Over the past two weeks, there have been no markets in “Depression” (RevPAR indexed to 2019 below 50). Recall, San Francisco and San Jose had lingered there since the beginning of the pandemic. Looking back over the past 28 days, 70% (37% inflation- adjusted) of markets are at “peak” RevPAR – the most since the Christmas holidays.


Around the Globe
Occupancy outside the U.S. fell to 52% from its 21-week high a week ago. ADR was relatively flat (+0.3%) but RevPAR decreased 3%. United Arab Emirates had this week’s highest occupancy level (79.9%) with Puerto Rico close behind (79.2%). Among the top 10 largest countries based on supply, the United Kingdom led in occupancy (70.3%) with Mexico a distant second (63.8%). The lowest occupancy of the top 10 was in China (36.8%), which has been trending down for the past six weeks due to COVID-related travel restrictions.
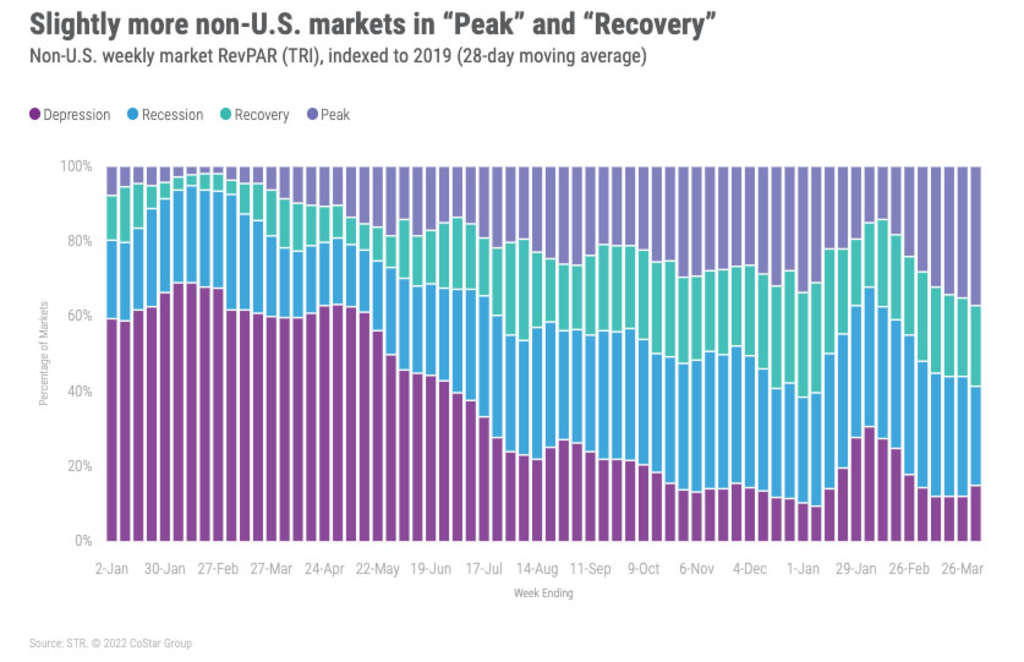
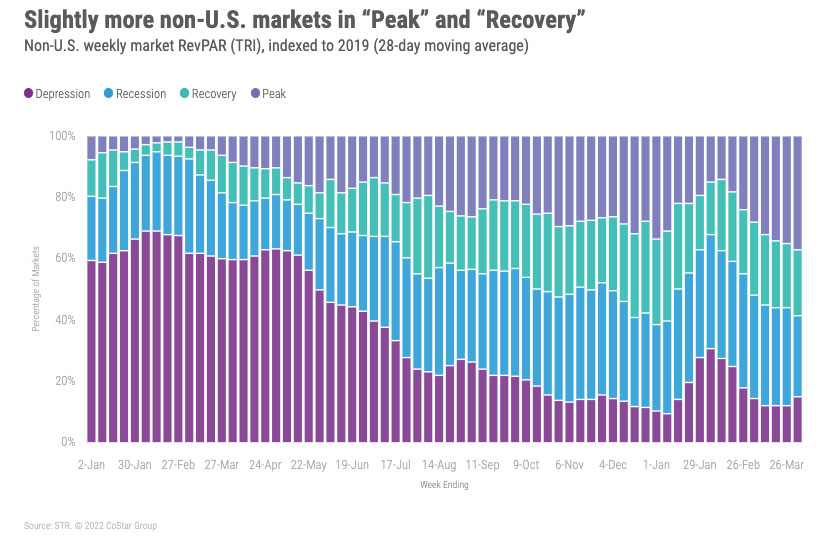
Dubai occupancy was among the highest in the world (82.5%), with Tasmania seeing higher occupancy (86.3%) but off a much smaller supply base. Dublin also noted strong occupancy this week (80.2%). In the latest 28-day review of markets, 51 were in “Depression,” up from 41 a week ago. There was some encouraging movement as slightly more markets were at “Peak” (37%) and “Recovery” (22%) versus the 28-day average from a week ago.
The Big Picture
Despite a slowing in the recovery tempo, the industry is on solid ground and heading in the right direction. As we noted with this week’s analysis, full recovery still hinges on the return of the Top 25 Markets, specifically Chicago, New York, San Francisco, and Los Angeles, along with the return of group business. Based on what we have seen over the past six weeks, we are encouraged to see that recovery is gathering strength in those markets. In a recent survey conducted for the U.S. Travel Association (USTA), 84% of business travelers expect to attend conferences, conventions or trade shows over the next six months. The USTA Business Travel Index (BTI) also points to a stronger level of business activity during Q2 2022 relative to Q1 2022. Thus, we remain optimistic.
About STR
STR provides premium data benchmarking, analytics and marketplace insights for the global hospitality industry. Founded in 1985, STR maintains a presence in 15 countries with a corporate North American headquarters in Hendersonville, Tennessee, an international headquarters in London, and an Asia Pacific headquarters in Singapore. STR was acquired in October 2019 by CoStar Group, Inc. (NASDAQ: CSGP), the leading provider of commercial real estate information, analytics and online marketplaces. For more information, please visit str.com and costargroup.com.