Market Recovery Monitor - 23 July 2022
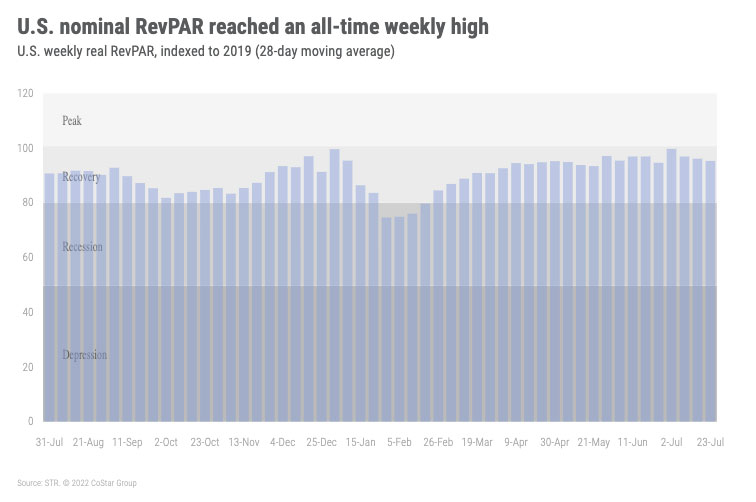
U.S. hotel room demand for the week ending 23 July 2022 reached its seasonal apex with more than 28.4 million sold. That was the country’s highest weekly total for rooms sold since mid-2019 and the 10th largest weekly amount of the past 22 years. As we have stated over the past several weeks, this annual demand peak was fully expected as it previously occurred during this week (week 30) in 15 of the past 22 years. While strong, this year’s week 30 was not the best week 30 ever. That honor remains with 2019 when 29.4 million rooms were sold. This year’s result, however, will go down as the fourth best for this particular week. Occupancy also reached a pandemic-era high of 72.8%, which was the highest level since early August 2019. Nominal average daily rate (ADR) continued to surprise, but rose by less than 1% week over week to US$158.79, making it the second highest nominal level recorded by STR since 2000, and US$0.69 below the record seen at the beginning of the year. Nominal ADR was up 16% over the comparable week in 2019 and 11% year over year. At US$115.59, nominal revenue per available room (RevPAR) advanced to the highest weekly level ever recorded by STR, rising by 2% week over week and 13% year on year. As compared with 2019, weekly nominal RevPAR was 9% higher.
Twenty-one markets saw their highest demand levels of the pandemic-era including Charlotte, Los Angeles, San Jose, and Portland, OR. Additionally, six markets, mostly smaller like Portland, ME, but including Charlotte, reached an all-time record high for weekly demand. While most markets did not surpass previous weekly highs, demand strength this week was widespread leading to impressive occupancy levels. Alaska once again led all STR-defined markets with the highest weekly occupancy (92%). “The Last Frontier” has been in the number one spot in five of the past seven weeks including the past fortnight. Portland, ME, San Diego, and Oahu also reported occupancy well above 85% for the week. Overall, 26 of the 166 STR-defined markets had weekly occupancy above 80% with another 78 between 70% and 80%. Combined, this was the highest number of markets with 70% occupancy since summer 2019. The lowest weekly occupancy of any market was in New Orleans (56%), which was abnormally low for the market. During the comparable week in 2019, NOLA occupancy was 67%, and in previous years, the metric topped 70% for the week.

The Top 25 Markets also had a good week with occupancy at 75%, the third highest occupancy for that group since the pandemic started. San Diego led the Top 25 Markets (87%), but nearly all were above 70% in the week. New York City occupancy topped 80% for a second consecutive week as did Boston, Denver, Orange County (Anaheim), and Seattle. Group demand, a foundation for the Top 25 Markets, was also robust and above 1.8 million rooms for a second consecutive week among Luxury and Upper Upscale hotels. This was the seventh largest amount of group demand since the start of the pandemic.
The week prior, we saw that weekday demand from the Top 25 Markets had led the resurgence in demand. In this most recent data, the growth was led by weekend demand outside of the Top 25 Markets. Overall, weekend occupancy hit 79%, the fifth highest level of the pandemic-era. In taking a closer look at this week’s total weekly demand growth, we noted that it was on the small side as it increased by only 301,000 room nights week over week versus an increase of three million a week prior. While the demand increase seems puny, it was well within the range seen historically for this week. In fact, this year’s week-on-week increase was the largest since 2011.
While this week’s demand growth was led by the weekend, weekday (Monday-Wednesday) occupancy remained solid with the week’s national level (73%) the highest of the pandemic-era. Weekday room demand was also the highest since March 2020. Weekday occupancy for the Top 25 remained above 75% for a second consecutive week, which was the third highest level since the start of the pandemic.
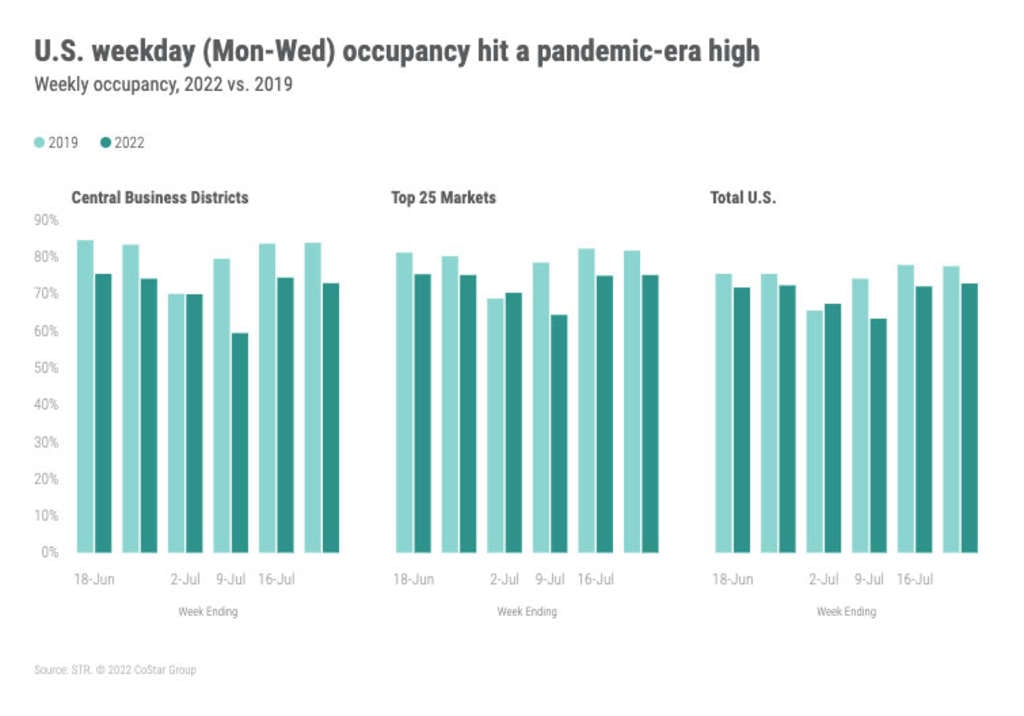

Central business districts (CBDs) also showed solid weekday occupancy (74%) albeit lower than a week prior.
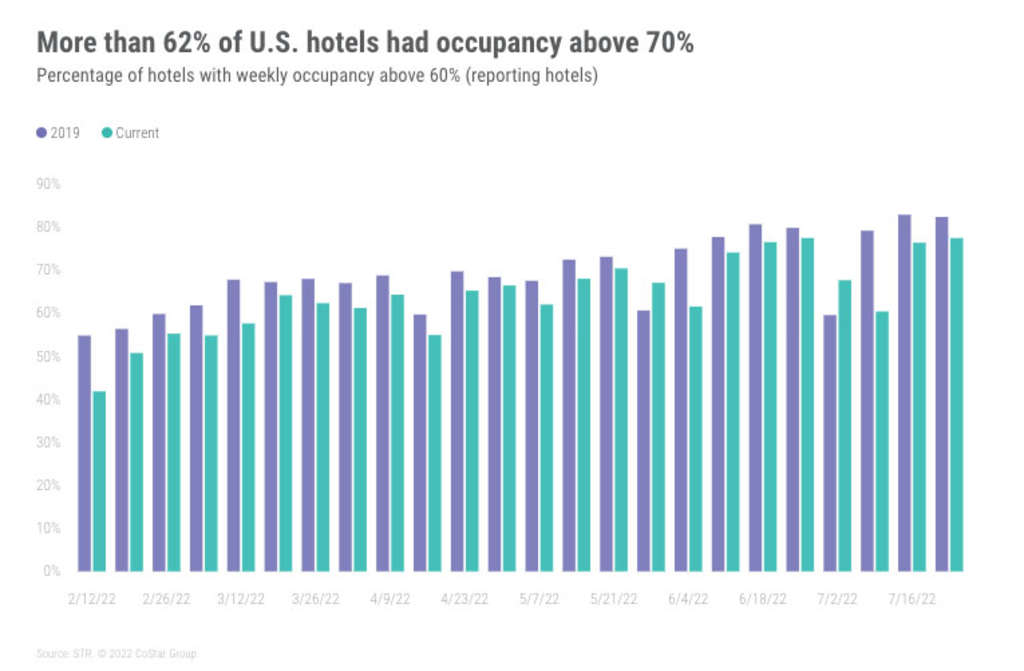
Like the markets, individual hotels saw strong occupancy with 42% of reporting hotels posting weekly occupancy above 80% this week. While strong, it still was below the percentage of hotels that reported that level of occupancy in the comparable week of 2019 (52%). Of concern, 22% of hotels saw occupancy below 60%, which was only marginally better than a year ago.
Upscale and Upper Midscale hotels continued to excel with both chain scales reporting their highest weekly demand ever. Upper Midscale surpassed the record demand set just a week ago. One third of all rooms sold this week among branded hotels were in Upper Midscale properties, where demand was 6.3 million. Upscale saw demand of 4.8 million.
Nominal ADR reached its second highest level ever recorded by STR since 2000. All but six markets reported weekly nominal ADR above 2019. What is even more remarkable, real (inflation-adjusted) ADR was the ninth highest seen since weekly benchmarking began. The highest was at the beginning of this year, a result of pent-up holiday celebrations. Three STR-defined markets, Orange County (Anaheim), Oregon Area, and San Diego saw their highest real ADR of all time. Indexed to 2019, 104 markets had real ADR above 2019 for the comparable week.
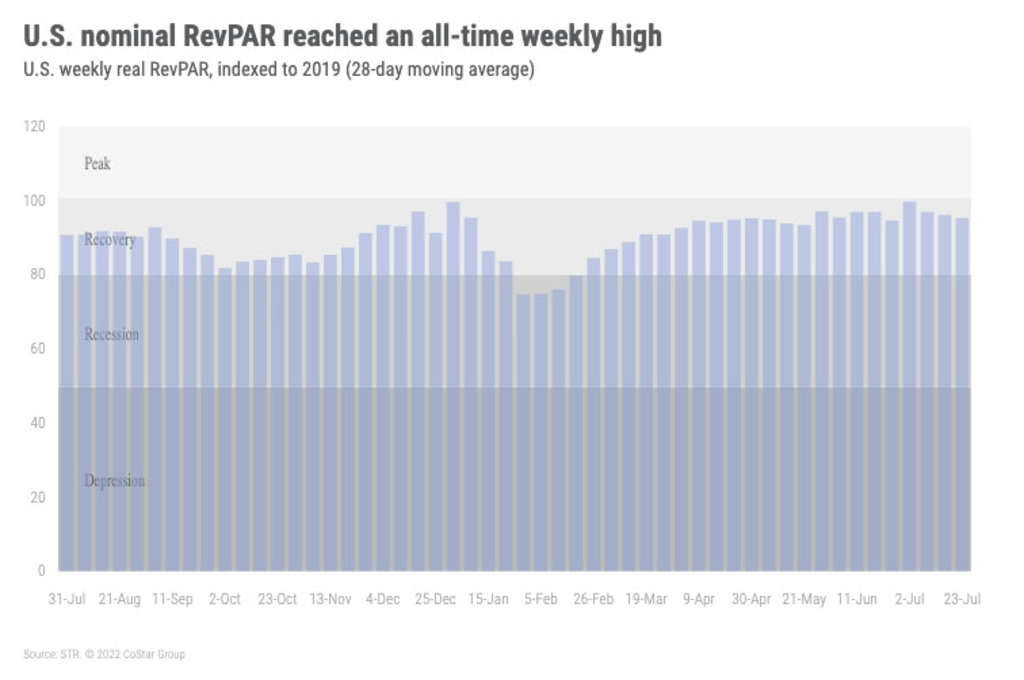
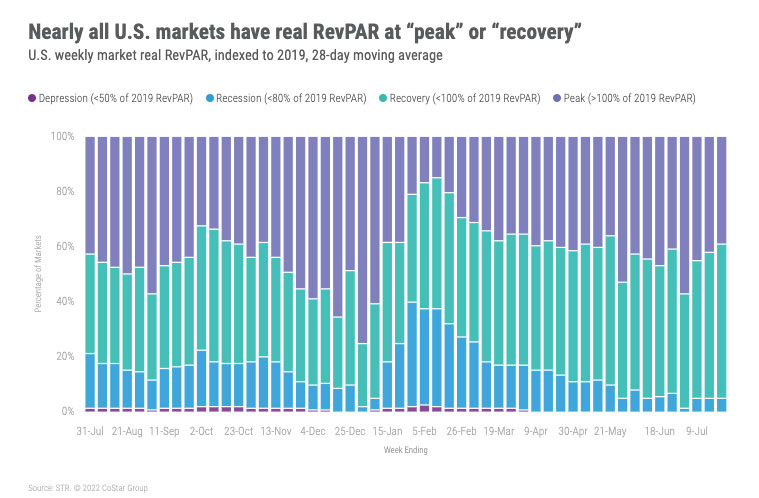
While nominal RevPAR advanced to the highest weekly amount ever recorded by STR, real RevPAR remained some distance from establishing a weekly record with a rank of 26 versus all weeks since 2000. However, at US$97, real RevPAR was the highest of the pandemic-era surpassing the previous high set just a week ago. Seventy-five of the 166 STR-defined markets saw weekly real RevPAR top 2019 for the comparable week as compared to 58 a week prior. Looking at the past 28 days, 65 markets are at “peak” real RevPAR (RevPAR indexed to 2019 above 100) and another 93 are in “recovery” (RevPAR indexed to 2019 between 80 and 100).

Around the Globe
Occupancy outside the U.S. reached 68%, which was highest level since the start of the pandemic. Occupancy has been on the rise for the past three weeks. Nominal ADR decreased by more than 2% week on week to US$148, one week after achieving a pandemic-era high of US$151. The week’s result was also the fourth highest since March 2020. Nominal RevPAR also fell from a pandemic-era high a week ago to US$100, which was the second best since the pandemic started.
Demand increased among more than half of the 103 countries covered weekly. The largest weekly demand increase was seen in China, with solid gains also coming in Turkey, France, Brazil, Mexico and Egypt. Ireland and Armenia had the week’s highest occupancy outside the U.S. (>85%).
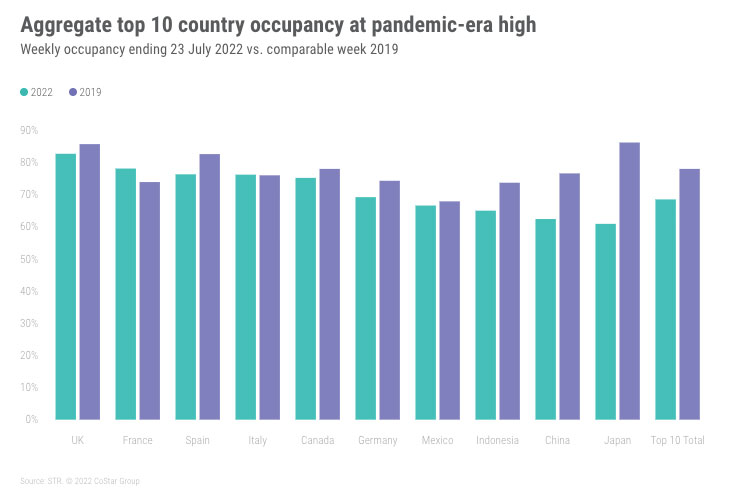
Among the top 10 largest countries, based on supply, the U.K. led with occupancy of 83%, just three percentage points below the 2019 comparable. France, Spain, Italy, and Canada all reported occupancy above 75% for the week. Occupancy in China continued to increase as it has for the past seven weeks—the country’s latest result (62%) was its highest of the year.

Of the 344 non-U.S. markets, 106 had weekly occupancy at or above 2019 for the comparable week. Several China markets came out on top in terms of recovery to 2019, including Fuzhou (+14.8 pp), Sanya (+10.6 pp), and Xiamen (+9.9 pp). Tier 1 cities, Shanghai and Beijing, continue to sit below 2019 levels by 31.2 percentage points and 45.5 percentage points, respectively. Occupancy in Paris was also a standout (87%), which was 8.6 percentage points ahead of 2019, and 3 percentage points higher versus the previous week.
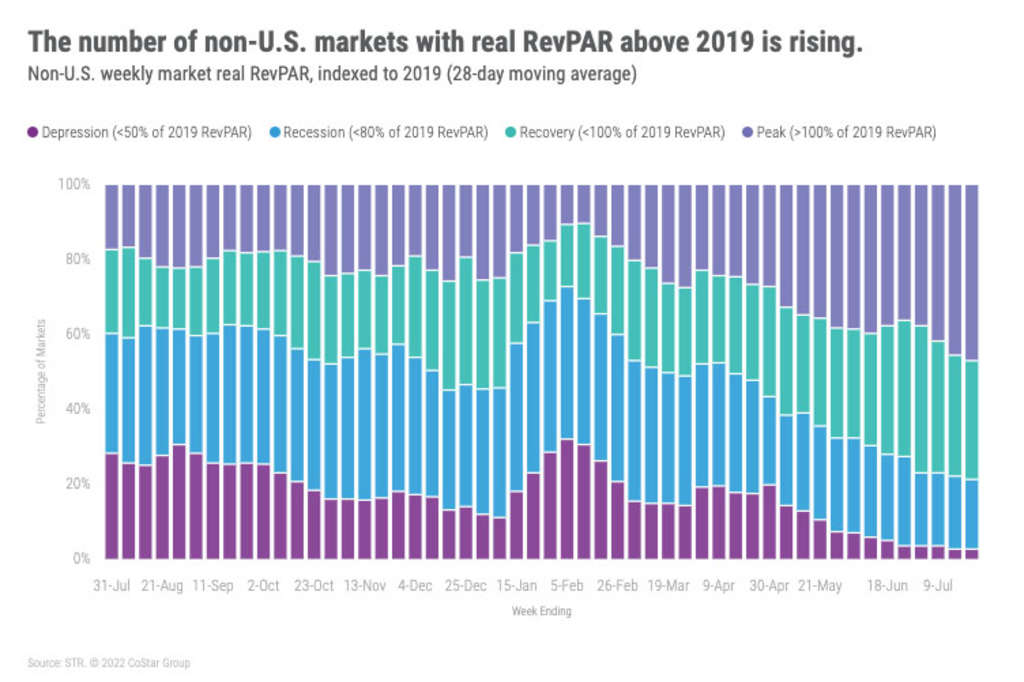
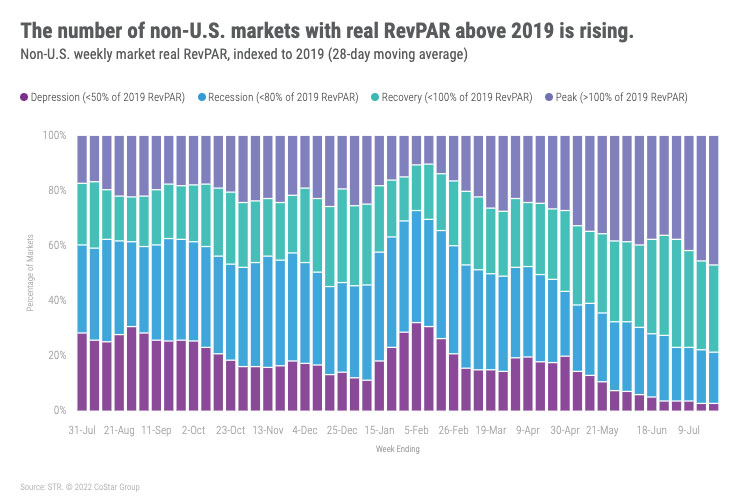
Using real RevPAR over the past 28 day, 19% of non-U.S. markets remained in “recession” (RevPAR indexed to 2019 between 50 and 80) while 3% were in “depression” (RevPAR indexed to 2019 under 50). On the flip slide, 47% of markets are at peak real RevPAR, the most since the start of the pandemic.
Big Picture
What happens now that we reached our annual peak in the U.S.? Our current thinking is that the industry will follow somewhat normal seasonal patterns. Demand and occupancy will begin to slow as students return to school. As a result, the next three weeks will likely see moderate demand declines. In 2017, 2018 and 2019, demand declined by about one million room nights in the week immediately following the annual peak. This time could be different as there is evidence based on TSA security screenings that the week ending 30 July could be strong. But in any case, we must accept that demand is going to wane with most of the decreases likely from normal seasonal patterns versus a significant change in the environment.
About STR
STR provides premium data benchmarking, analytics and marketplace insights for the global hospitality industry. Founded in 1985, STR maintains a presence in 15 countries with a corporate North American headquarters in Hendersonville, Tennessee, an international headquarters in London, and an Asia Pacific headquarters in Singapore. STR was acquired in October 2019 by CoStar Group, Inc. (NASDAQ: CSGP), the leading provider of commercial real estate information, analytics and online marketplaces. For more information, please visit str.com and costargroup.com.