U.S. hotel commentary - March 2023
March 2023 Top-Line Metrics (percentage change from March 2019):
- Occupancy: 65.3% (-4.0%)
- Average daily rate (ADR): US$158.17 (+19.1%)
- Revenue per available room (RevPAR): US$103.35 (+14.4%)
March 2023 Bottom-Line Metrics (per available room, % change from March 2022):
- GOPPAR: US$95.12 (+14.5%)
- TRevPAR: US$238.22 (+17.5%)
- EBITDA PAR: US$71.07 (+14.4%)
- LPAR (Labor Costs): US$74.43 (+23.4%)
Key points
- Supply growth has slowed substantially, and modest growth remains the trend for 2023, which will provide breathing room to grow occupancy as the economy cools.
- U.S. demand growth trends have normalized, and the modest occupancy gap relative to 2019 will be increasingly difficult to close. Weekdays have yet to close the gap as business travel continues to slowly recover.
- Rate growth continues to drive RevPAR growth, and while ADR is still posting very strong YoY growth rates, moderating inflation and normalized demand growth are leading to deceleration in the growth rate.
- The top three chain scales reported month-over-month improvement in demand indexes, while the bottom three chain scales and independent properties declined month over month.
- After a slow start to the year, group demand for March 2023 is up 19% YoY and groups continue to post strong YoY ADR growth, although this has decelerated substantially as rates have recovered and normalized.
- The Top 25 Markets appear back on track as weekday occupancy recovery and ADR indexes are strong with the March weekday ADR index reaching its highest level to date.
- U.S. hotel total revenue per available room (TRevPAR) was the highest for any month on record.
One quarter of the way through 2023, industry results reflect a shift in mindset to a true post-COVID environment, with 2.8% demand growth and 7.8% ADR growth leading to respectable 10.4% RevPAR growth year over year. This post-COVID mindset is evidenced in several areas:
Year-over-year supply growth has held at less than 1% for eight consecutive months. Year to date, supply growth is slightly below projections, which has offered some breathing room for existing hotels to grow occupancy without a massive demand influx.
Demand growth is back into pre-pandemic territory. At +2.8% YoY, March 2023 demand growth sat firmly within normal historical ranges – average growth was +2.0% between 1988-2019 and +2.6% between 2011-19.
Hotel demand dipped back below 2019 levels for the first time since November 2022. A perfectly linear recovery trend is basically impossible to maintain, and a four-year-old benchmark is increasingly difficult to measure against. This loss came because of slower weekend demand.
Historically, weekend (Friday and Saturday) occupancy rises 8-10 points between February and March, with some modest variability depending on when Easter and Passover fall. This year, weekend occupancy during March increased only 6 points from February.
Weekday (Sun-Thurs) occupancy is increasing each month at roughly the same pace as pre-pandemic times. The trend around weekday business travel is there, but the actual occupancy level is not yet to 2019 levels.
ADR growth, at +7.8% YoY, was modest by recent standards, but still ahead of inflation, which was 5.0% in March.
While weekend occupancy trailed, weekend rates remained strong, which could be one of the reasons behind the softer occupancy. A weekend hotel room cost $166 in March, which was a $12 premium on the other five days of the week.
Chain Scales
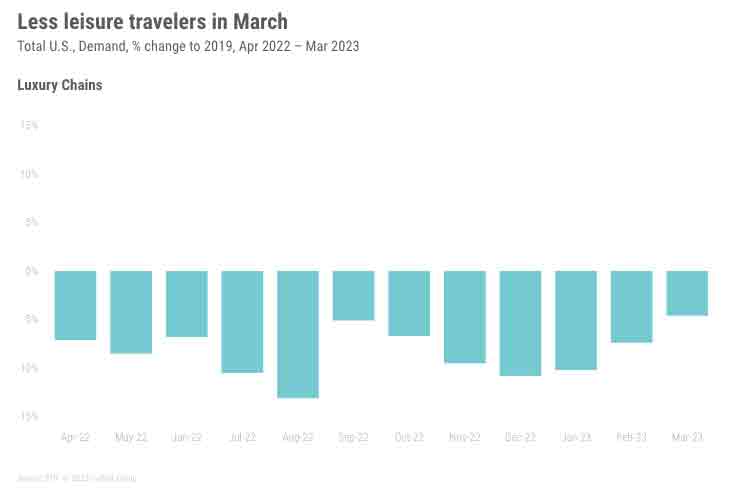
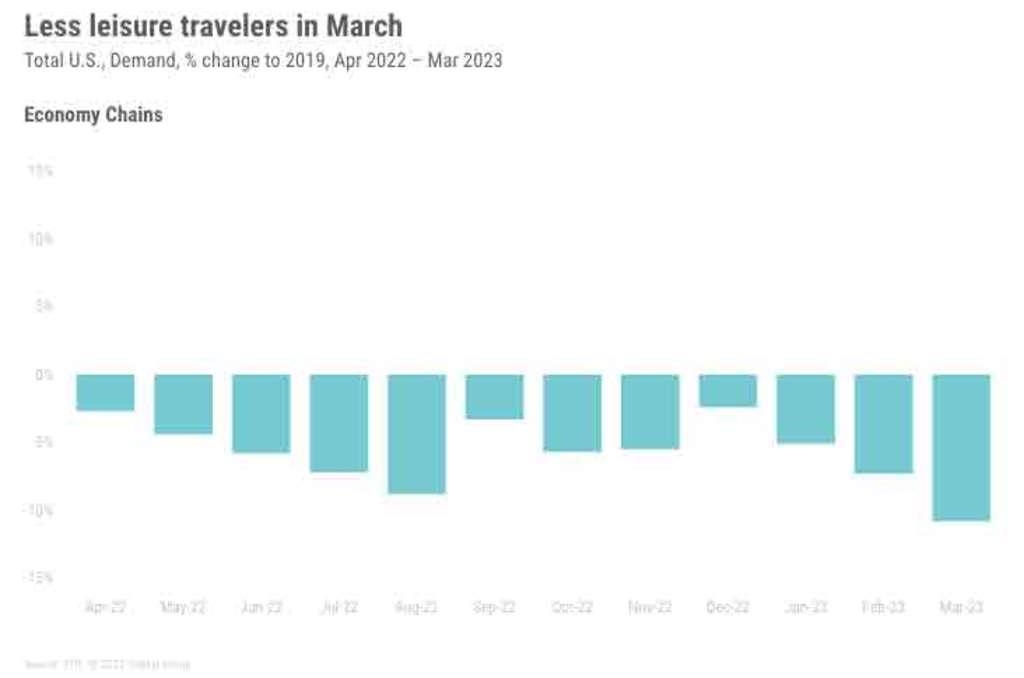
U.S. hotel demand by chain scale, indexed below to 2019, reflects the lighter weekend occupancy seen across the industry.
Luxury, upper upscale, and upscale hotels reported month-over-month improvement in the demand indices. These are also the chain scales reporting the strongest supply growth, so the impact on occupancy was more muted but still evident.
Upper midscale, midscale, and economy chain indices declined month over month. Economy chains continue to report YoY declines in both supply and demand, with occupancy now having declined YoY for 12 consecutive months.
Independent properties, which are by room count roughly 42% economy class and 65% upper midscale and midscale, showed a similar demand decline at -0.6% YoY.
The trend observed above across the U.S. – slowed, normalized demand and occupancy growth – is also clear across almost every chain scale. Omicron comps are behind us, and YoY growth in occupancy is normal for every chain but upper upscale.
Segmentation
After a slow start to the year, group demand returned. March 2023 was up 19% YoY, however the index to 2019 was back to where it was before a combination of poor comps and winter slowness led to a weak January and February.
High-end transient demand continues to be strong, and the uptick in group has put demand recovery back in line.
In terms of rate, group travel is driving growth. Whether looking at the 2019 index or YoY comps, transient ADR growth has slowed.
Groups continue to post decently high YoY ADR growth, although the YoY percentage has decelerated substantially as rates have recovered and normalized.
Top 25 Markets
At the market-level, the Top 25 Markets are back on track with weekday occupancy recovery.
Additionally, weekday occupancy indices declined month over month outside of the Top 25 Markets, which could point to a return to major market business demand.
Markets with the weakest occupancy indices – Minneapolis, Philadelphia and New Orleans – are all fairly far down the line in YoY growth, meaning that they are still struggling to come back in 2023.
San Francisco continues to report the weakest occupancy index but higher YoY growth than the aforementioned trio of struggling major markets. The markets with the strongest YOY growth are already far along in their recovery, meaning further growth is likely to be slow.
Monthly P&L
U.S. hotel total revenue per available room (TRevPAR) was the highest for any month on record. Revenues and profits improved for a second consecutive month with each of the key profit-and-loss metrics showing double-digit growth year over year. The increase in TRevPAR prevented labor costs from placing further pressure on GOPPAR.
While each of the Top 25 Markets saw GOPPAR levels above March 2022, Los Angeles was the only major market to realize a TRevPAR level lower than that comparable. Read more here.
Latest Weekly Insights
Helped by group demand, which was the third highest of the pandemic-era, occupancy (67.2%) for the week ending 22 April was the second highest of the year, behind the week ending 18 March (67.5%). Read more here.
About STR
STR provides premium data benchmarking, analytics and marketplace insights for global hospitality sectors. Founded in 1985, STR maintains a presence in 15 countries with a North American headquarters in Hendersonville, Tennessee, an international headquarters in London, and an Asia Pacific headquarters in Singapore. STR was acquired in October 2019 by CoStar Group, Inc. (NASDAQ: CSGP), a leading provider of online real estate marketplaces, information and analytics in the commercial and residential property markets. For more information, please visit str.com and costargroup.com.


