STR Weekly Insights: 25 February – 2 March 2024
Countries (markets) mentioned:
- United States (Baltimore, Dallas, Houston, Las Vegas, Miami, Nashville, Oahu, Orlando, San Francisco, San Jose/Santa Cruz, Seattle)
- Indonesia (Bali, Jakarta), Spain (Barcelona), Singapore
Highlights
- U.S. RevPAR increased after the previous week’s decline.
- U.S. Group demand soars.
- Global RevPAR strengthens despite weakening in China.
- Singapore bookings are up because of Taylor Swift.
- Is there a Leap Day impact?
U.S. Performance
Growth in revenue per available rooms (RevPAR) returned to the U.S. following the previous week’s decrease. Occupancy held somewhat steady, average daily rate (ADR) increased, weekday (Monday-Wednesday) performance grew, and group demand exploded, surpassing both the 2023 and 2019 comparables.
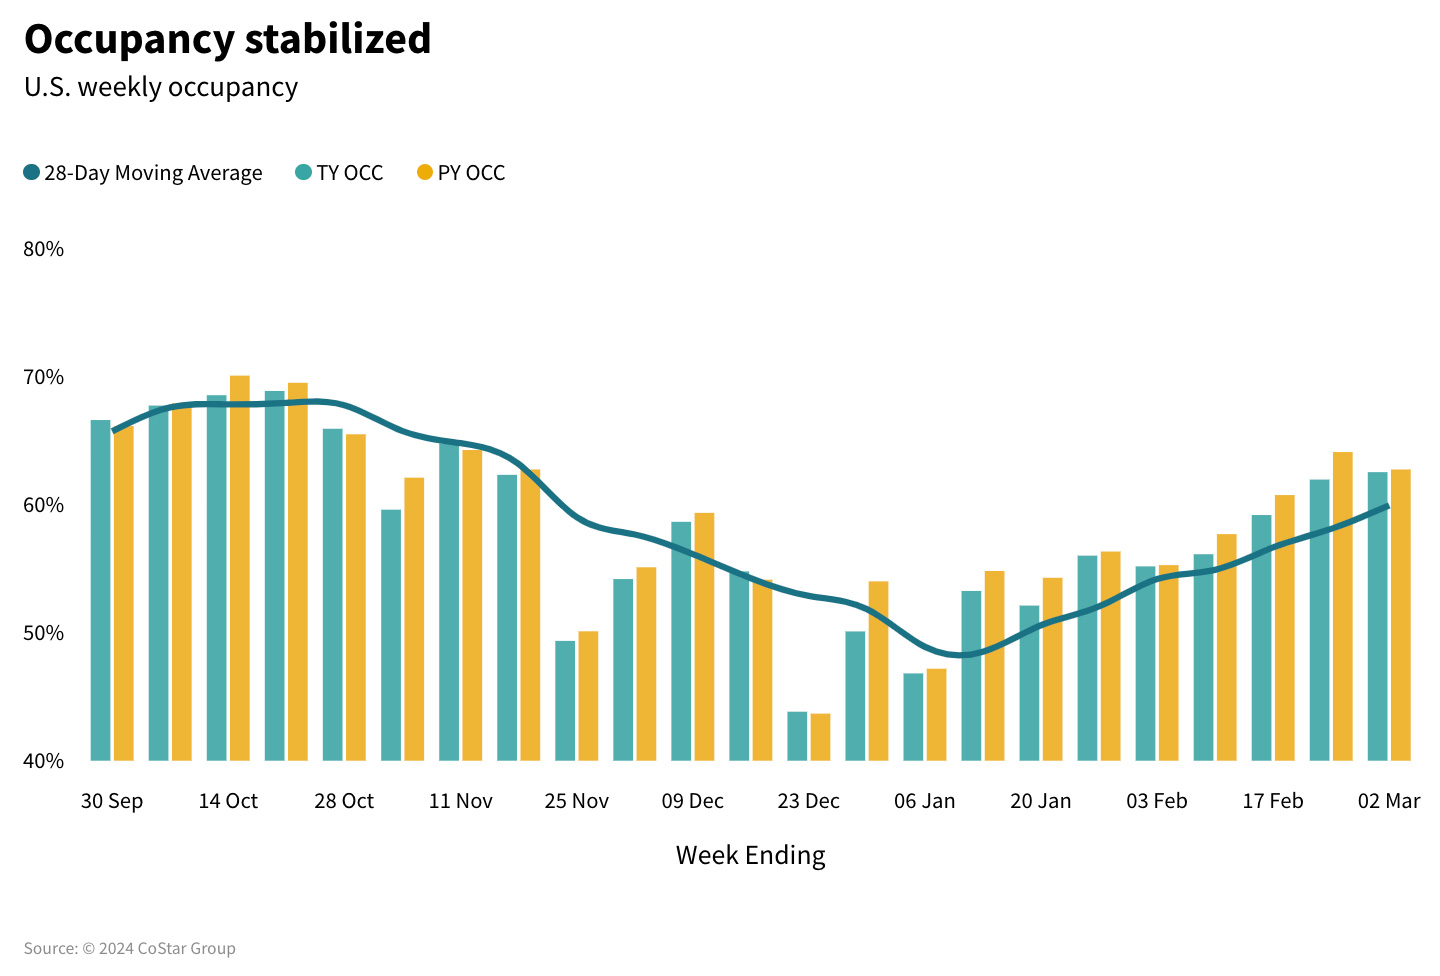
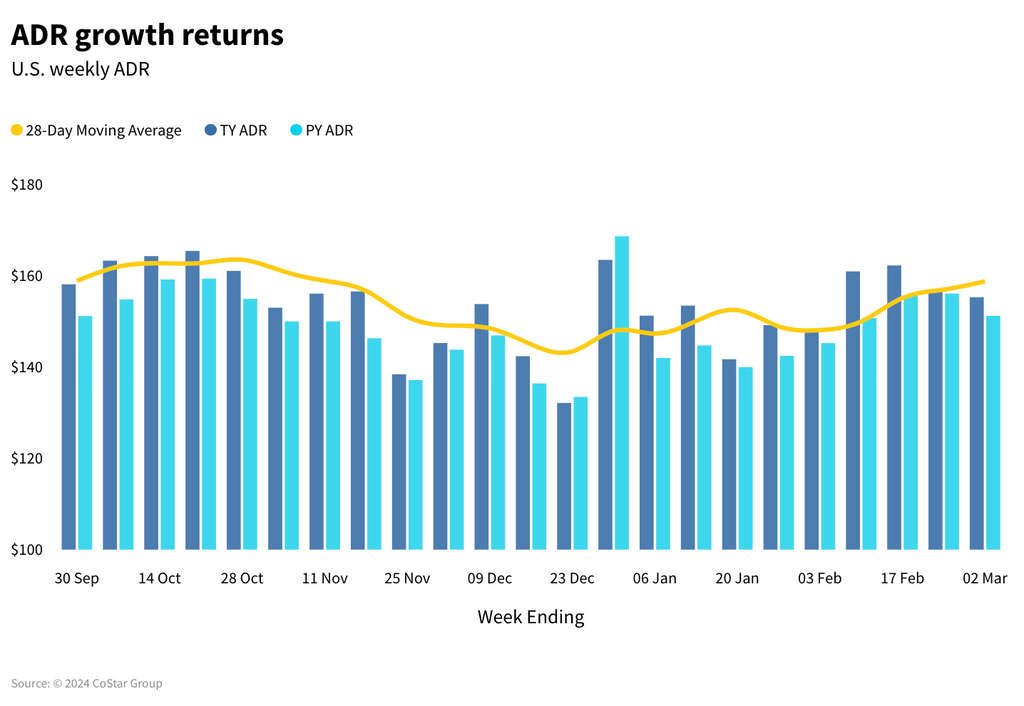
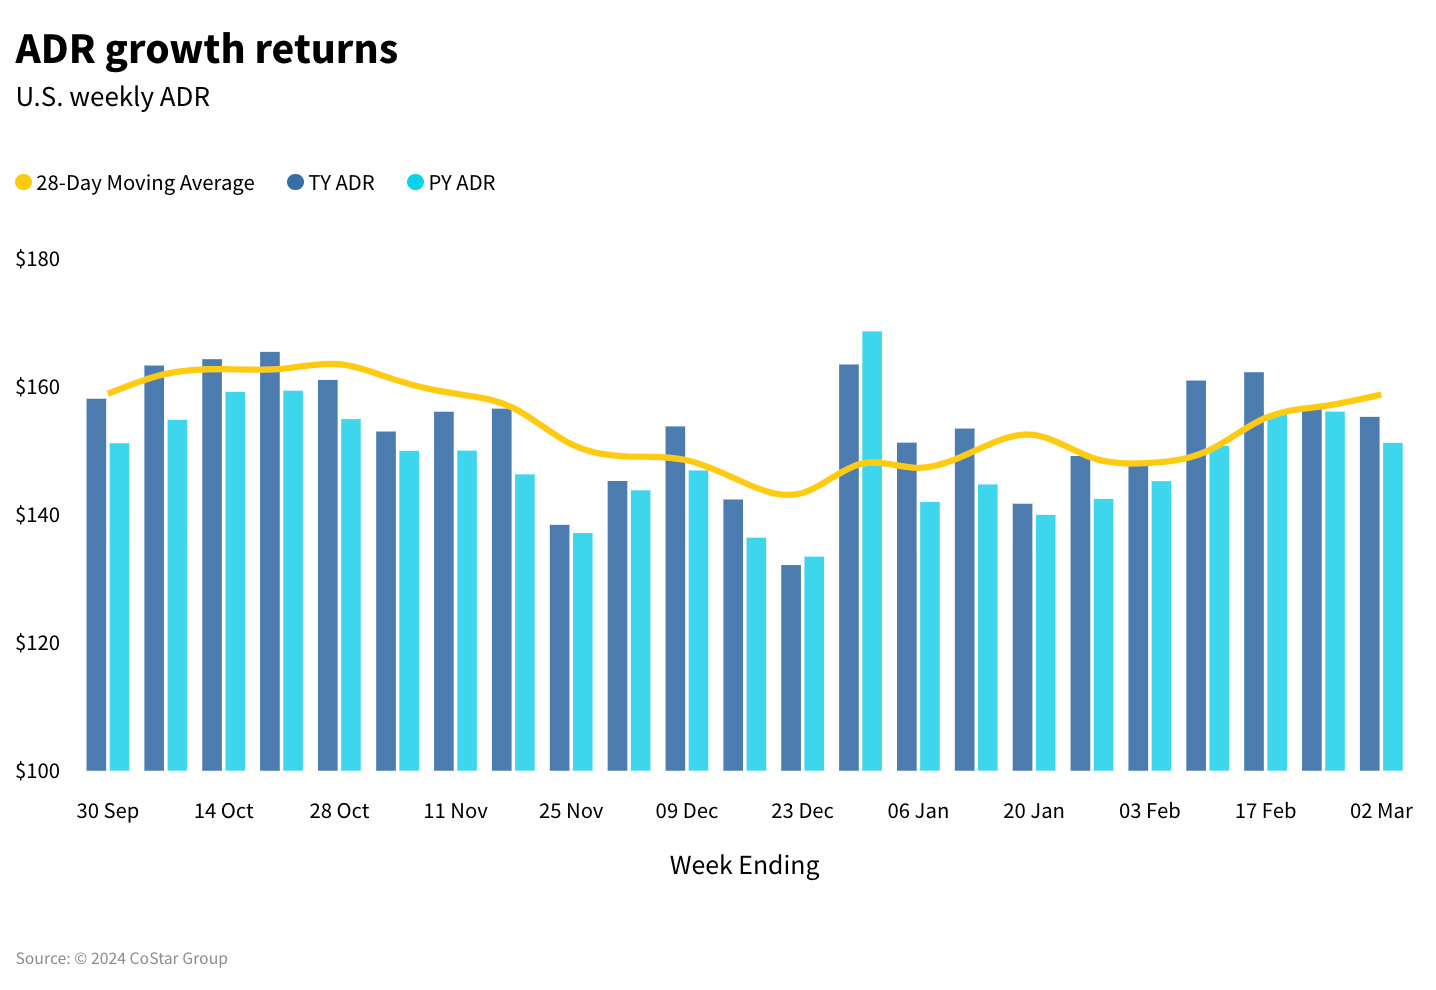
At 62.5%, occupancy dropped a fraction (-0.2 percentage points year over year) while reaching the highest level of 2024 thus far (+0.5ppts from the prior week). Following a decline the previous week, ADR increased 2.7% year over year (YoY), driving RevPAR up 2.3%.
Day-of-Week Movement
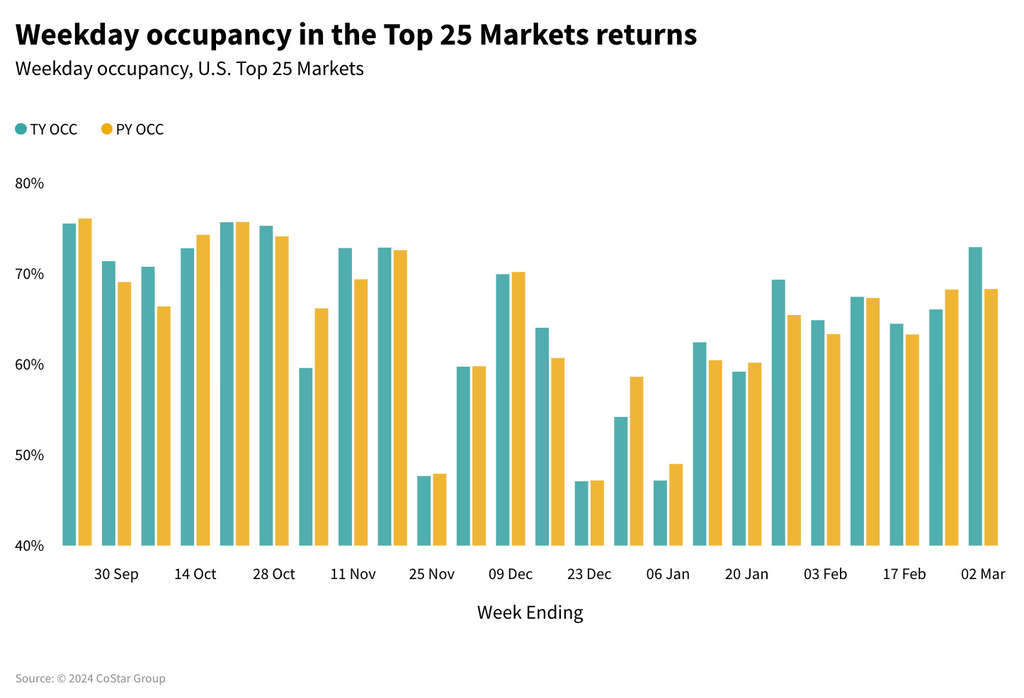
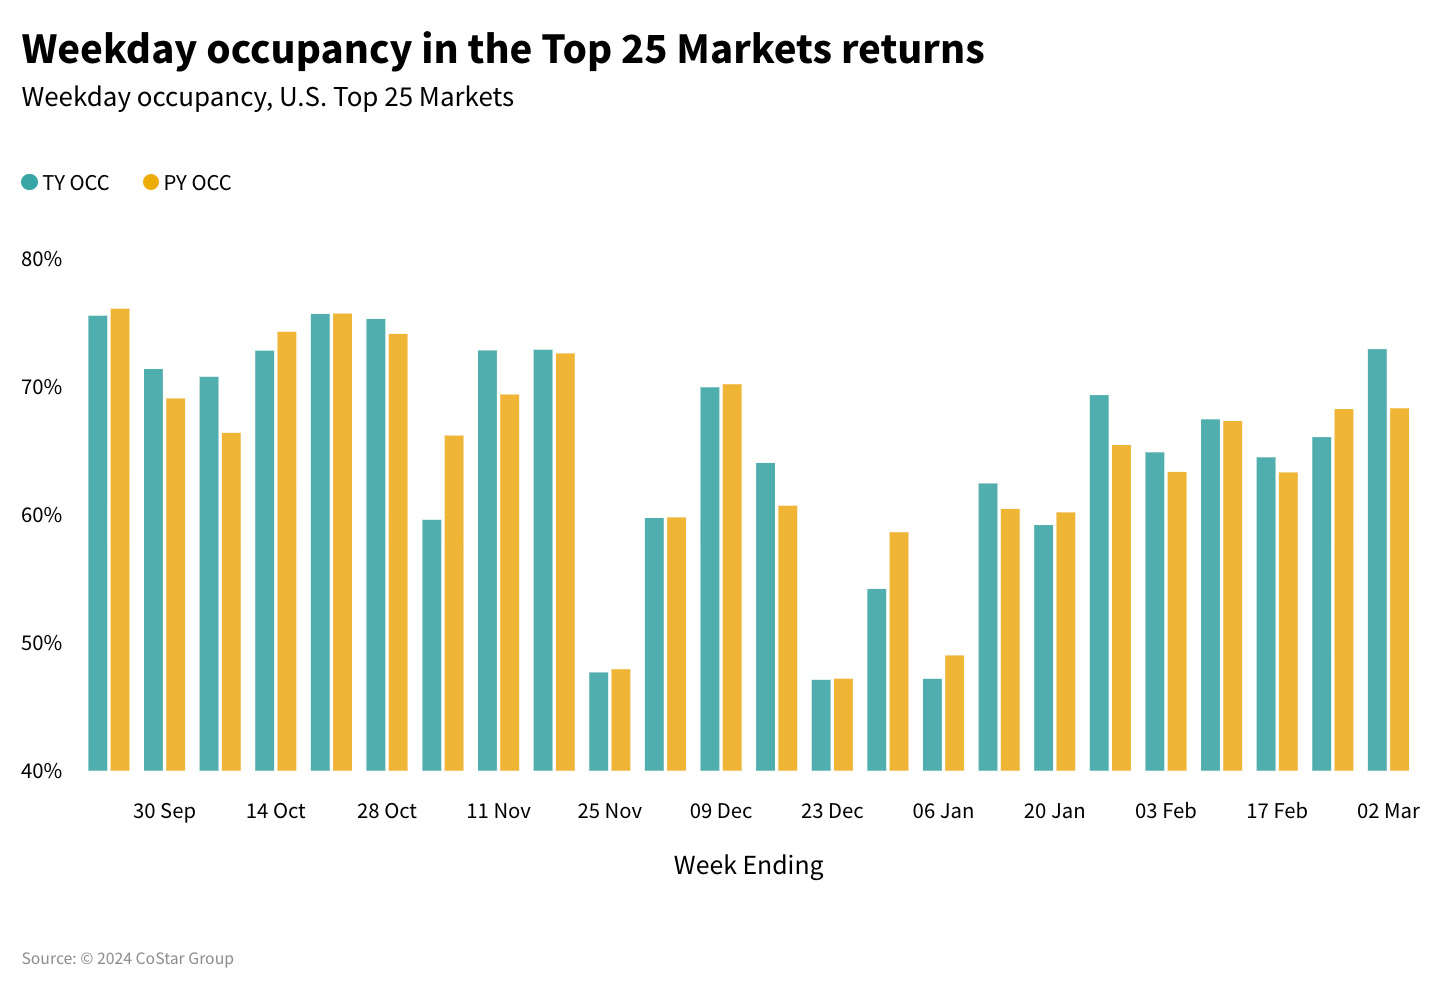
Weekdays showed the strongest performance with occupancy up 1.4ppts and ADR rising 6.5%, yielding RevPAR growth of 8.9%. The Top 25 Markets drove much of the performance with weekday RevPAR up 9.5%, lifted equally by ADR (+4.0%) and occupancy (+3.6ppts). Weekday performance across the rest of the country was ADR-driven (+2.7%), while occupancy declined slightly (-0.4%). The weekend (Friday & Saturday) took the biggest hit with RevPAR down more than 4% both for the Top 25 Markets and the rest of the country. The shoulder days (Sunday and Thursday) also showed a RevPAR decline (-0.6% for Top 25 Markets and -1.3% in the remaining markets).
Market-Level Leaders
Among the Top 25 Markets, Las Vegas again took top honors with RevPAR up 36.5%, a result of an ADR gain of 25.4% and an occupancy lift of 7.1ppts—all driven by the International Builders Show. Last year, the event was a month earlier.
Four other markets, Seattle, Oahu, Houston, and Dallas, saw double-digit RevPAR gains due to varied events. San Francisco also saw strong RevPAR growth (+9.1%) via improvement in occupancy. Across the next 25 largest markets, Baltimore and San Jose/Santa Cruz experienced double-digit RevPAR gains, up 23.8% and 11.6%, respectively.
More Group Gains
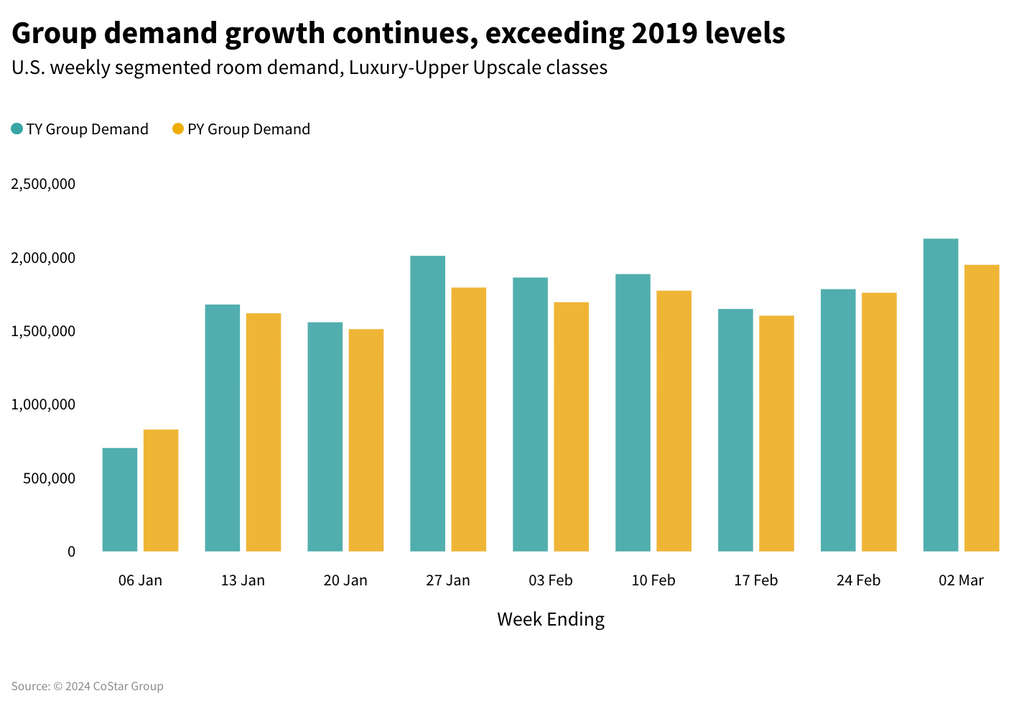
Group demand (among Luxury and Upper Upscale hotels) grew for the ninth straight week, increasing 9.1% YoY and surpassing the 2019 comparable by 1.9%. Group ADR also continued to grow, holding above 5% YoY for the fourth consecutive week. Almost all the group demand growth occurred in the Top 25 Markets, where group occupancy was up 2.7ppts. Elsewhere, group occupancy was up 0.3ppts. Nine of the Top 25 Markets exceeded the 2.7-ppt average, including Oahu, Las Vegas, Houston, Dallas, Seattle, Orlando, San Francisco, Miami, and Nashville.
Class-Level Performance
RevPAR increased for the top three hotel classes (Luxury, Upper Upscale and Upscale), lifted by both ADR and occupancy. The continued strength of group demand is a significant tailwind for many hotels and mostly for those in the Luxury and Upper Upscale classes.
Upper Midscale hotels were essentially flat with an occupancy decline offset by an ADR increase. Midscale and Economy class hotels continued to see soft performance. Possible explanations for this softness include lack of group meeting facilities, which is currently providing a tailwind for the upper-tier hotels and a general shift in the structure of these two hotel classes with a significant number of properties closing and/or moving out of the segment.
Analysis of day-of-week trends revealed a pattern like the one seen overall with weekdays recording the least negative impact and weekends showing the most negative impact. Given that weekends generally provide the greatest demand for these segments, the decline of weekend travel in Midscale and Economy class hotels is more pronounced.
Indonesia Gains Occupancy
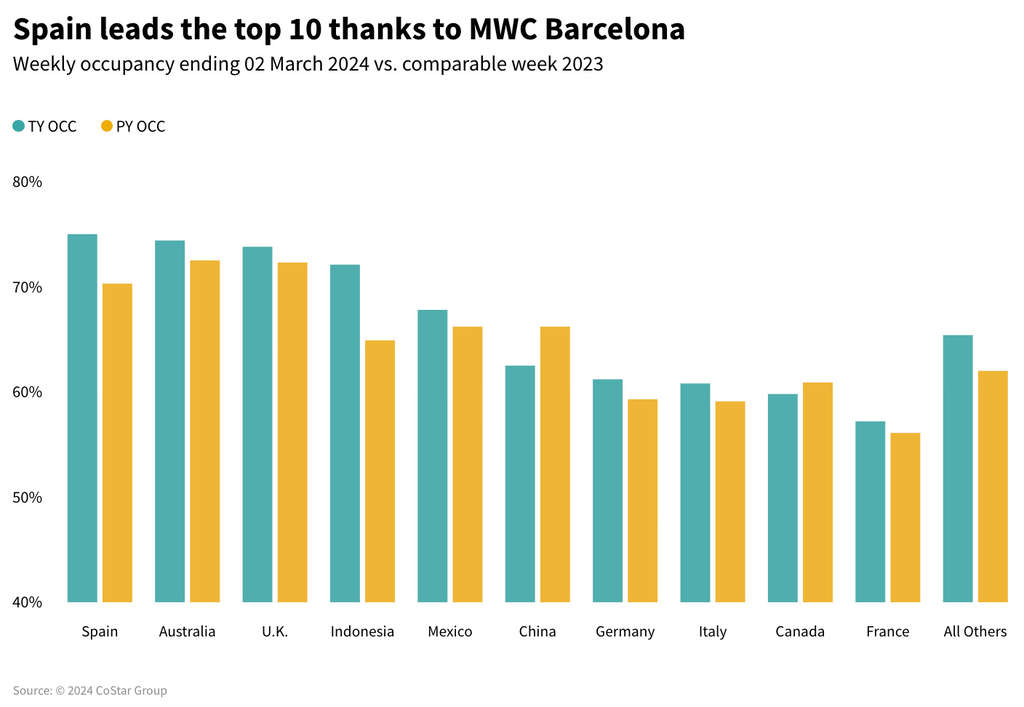
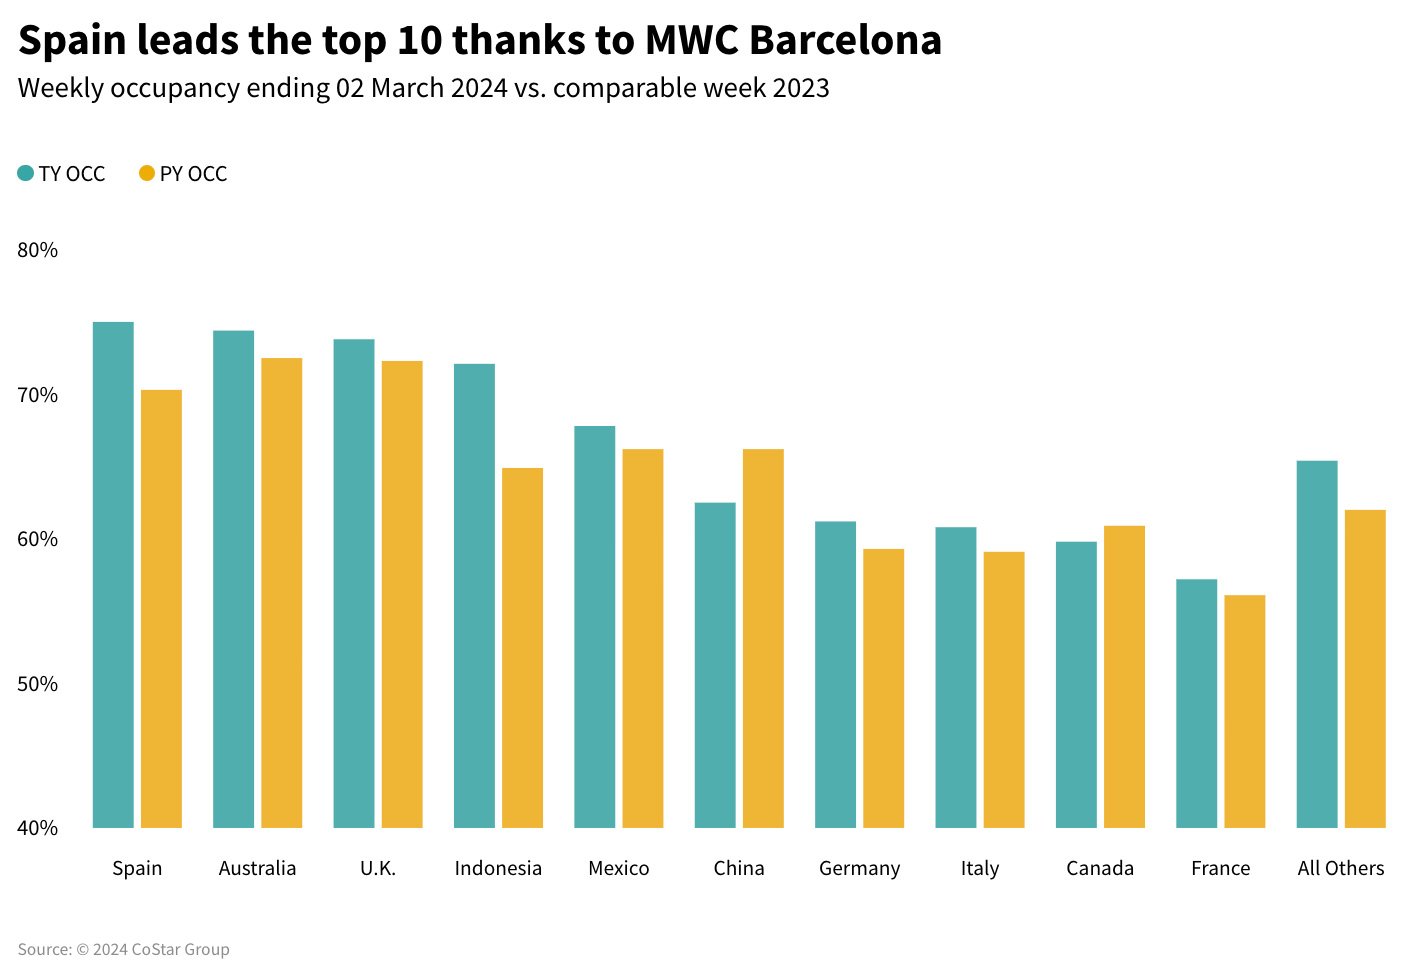
Looking at select top countries elsewhere in the world, strong performance continued with eight of 10 countries seeing positive occupancy gains and six of 10 seeing ADR increases. Indonesia posted the largest occupancy gain (+11.1ppts to 72.1%) with ADR up 11.3%. The occupancy increase in Indonesia was supported by many markets throughout the country with the capital, Jakarta, up 8.6ppts YoY to 78.7%. Leisure destination, Bali, grew occupancy 6.5ppts YoY to 67.4%.
Spain Stands Out
Spain posted the highest actual occupancy among the top countries, up 4.7ppts YoY to 75%. Occupancy throughout Spain was led by leisure markets. Additionally, Barcelona hosted the Mobile World Congress (MWC), an event that drew more than 100,000 visitors over a four-day period. Spain’s ADR grew 8.2%, with Barcelona driving a large portion of the increase at +13.4% to US$379.
China slowing
China experienced another slow week, post-Chinese New Year, with YoY declines in both occupancy (-3.9ppts) and ADR (-3.7%). Year-over-year growth has obviously softened now that the country is beyond the early-2023 comparables that were influenced by reopening.
Looking ahead
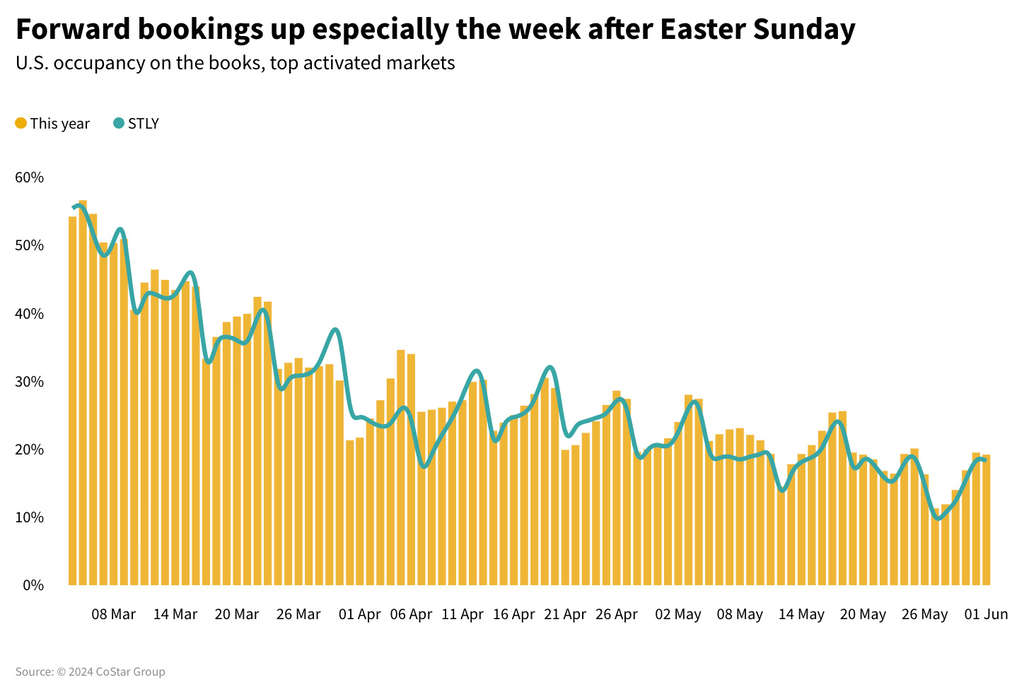
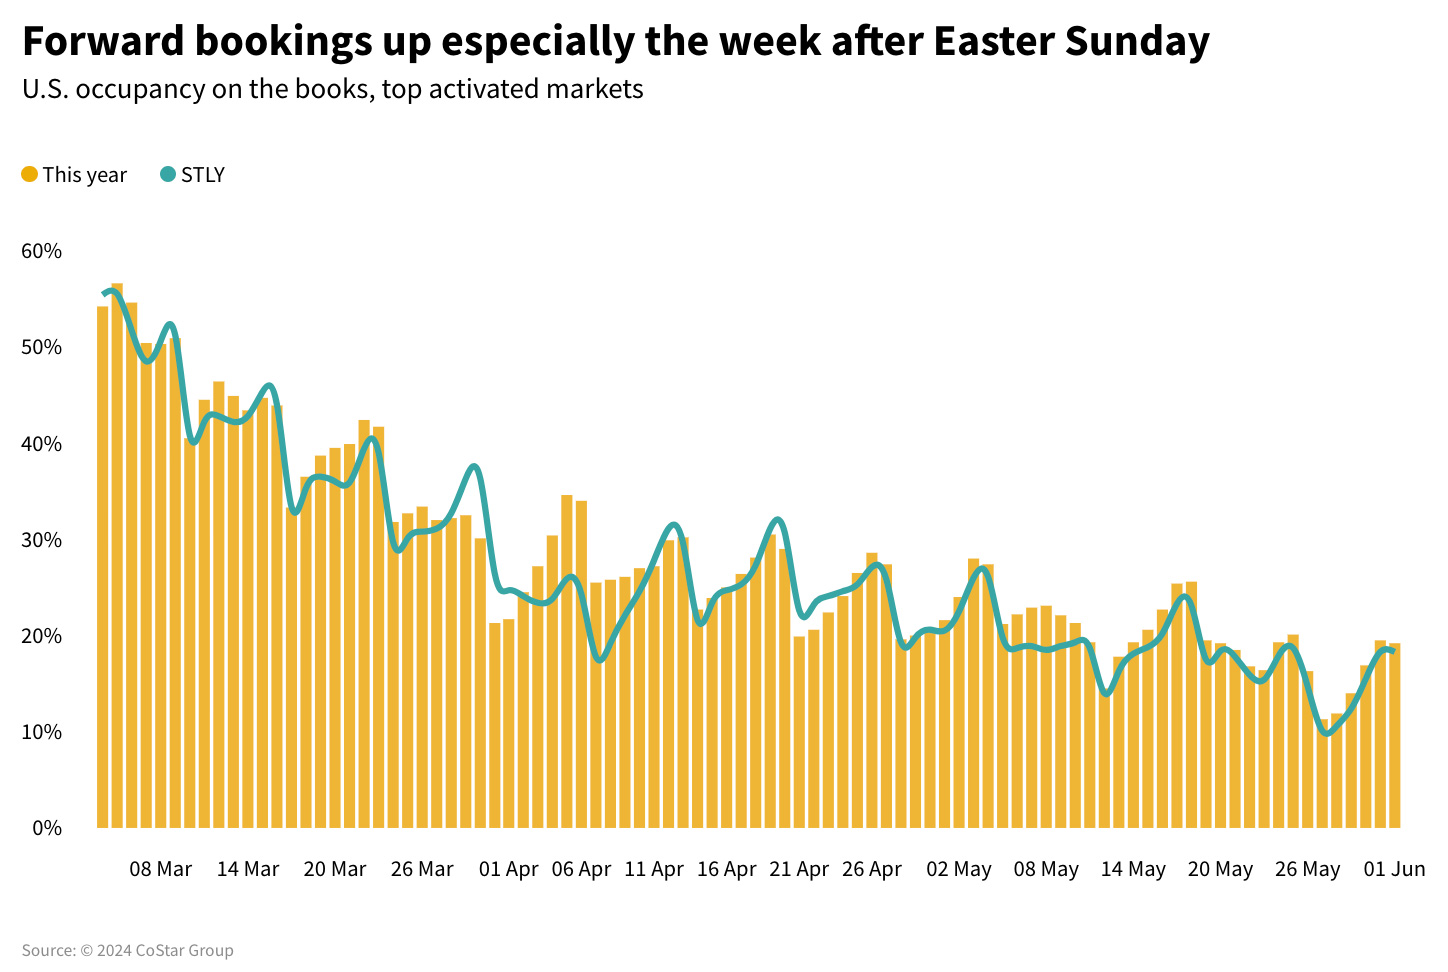
It was a good week for the industry following a hiccup. As Spring travel gears up for much of the world, hotel performance is expected to grow. Positive trends in forward bookings, strong group demand buoyed by the strong performance seen over the past nine weeks, and an early spring break season in the U.S. should provide tailwinds as the year progresses.
Global performance continued to be strong and is expected to remain on a positive trajectory over the coming months with similar tailwinds, as the Taylor Swift Eras tour is also expected to boost hotel performance. In next week’s reporting, expect strong gains in Singapore given that occupancy on the books (as of 4 March) for concert dates (March 7-9) was up 11ppts.
Leap Day Impact
This past week included Leap Day, which fell on a Thursday versus Saturday during the last Leap Day (2020). The last time Leap Day fell on a Thursday was in 1996. While this extra February day is included in weekly reporting, it will not be noticeable in monthly reporting as it will be “grossed down” into a 28-day month to allow like-for-like comparisons versus previous years.
*Analysis by Isaac Collazo, Chris Klauda, Will Anns.
About STR
STR provides premium data benchmarking, analytics and marketplace insights for the global hospitality industry. Founded in 1985, STR maintains a presence in 15 countries with a North American headquarters in Hendersonville, Tennessee, an international headquarters in London, and an Asia Pacific headquarters in Singapore. STR was acquired in October 2019 by CoStar Group, Inc. (NASDAQ: CSGP), the leading provider of commercial real estate information, analytics and online marketplaces. For more information, please visit str.com and costargroup.com.


