U.S. hotel commentary - August 2024
Top-Line Metrics (August 2024 vs. August 2023):
- Occupancy: 66.9% (+1.5%)
- Average daily rate (ADR): US$157.84 (+2.3%)
- Revenue per available room (RevPAR): US$105.67 (+3.9%)
Key Points
- RevPAR growth aided by extra weekend.
- All chain scales post RevPAR gains, including Economy.
- Pipeline up for a sixth consecutive month.
Overview
U.S. hotel revenue per available room (RevPAR) rose 3.9% year over year (YoY) in August, following a lackluster July. Growth was driven by average daily rate (ADR), which increased 2.3%. For the first time since February, the ADR increase was nearly equal to the monthly rate of inflation (2.5%). After two months of declines, occupancy improved by 1ppt to 66.9%, which was 4.1ppts below August 2019.
The August results are encouraging, but the month’s composition included an extra Friday and Saturday versus last year. On a day-matched basis, RevPAR was up 2.3% or 1.5ppts lower than the date-matched actual. This month’s variance between the two methodologies was the largest of the year so far. Looking at the three full weeks that were matched in both 2023 and 2024, RevPAR was up 2.4% and better than the 2% in 2023. Thus, RevPAR did improve, but the month can’t be looked upon as signaling stronger RevPAR growth in the months ahead.
Supply growth remained nearly non-existent at +0.4%, meaning there were 24,000 more rooms to sell per day in August than a year ago. We don’t expect the remainder of the year to see any notable change in the growth rates.
Chain Scales
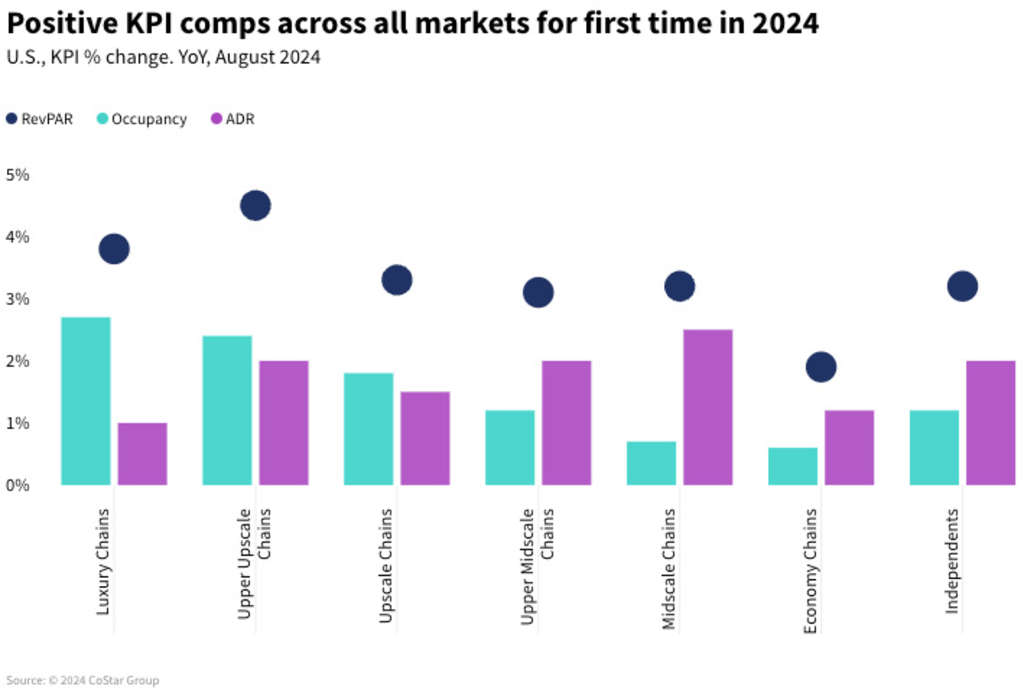
For the first time since March 2023, all chain scales saw RevPAR growth ranging from +4.5% in Upper Upscale to +1.9% in Economy. Other than in Economy, all chain scale RevPAR was above 3%. Luxury also posted solid growth via occupancy and ADR gains; the latter is notable as it was the first growth since December 2022.
Economy’s first RevPAR gain in more than a year was predominately led by ADR (+1.2%) with a slight gain in occupancy even though demand was down (-0.6%). Occupancy was up despite the decrease in demand as supply in the segment fell 1.3% from a year ago.
Segmentation
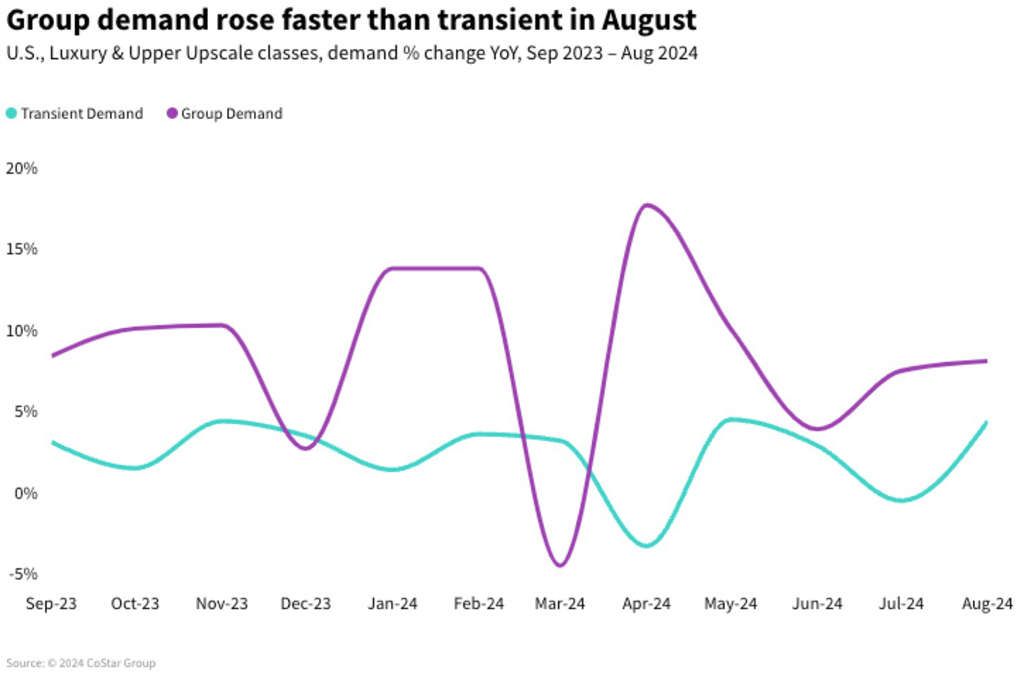
Transient demand in Luxury and Upper Upscale classes accelerated in August (+3%) after a flat July (+0.4%). Transient ADR gained (+1.3%) for a third time this year. Group demand growth was unchanged (+3.6%) compared to July, and Group ADR continued to show healthy gains (+4.3%). Group ADR has increased consistently since the end of the pandemic, and from February 2024, has averaged a 5.2% increase versus Transient’s -0.1% change.
Top 25 Markets
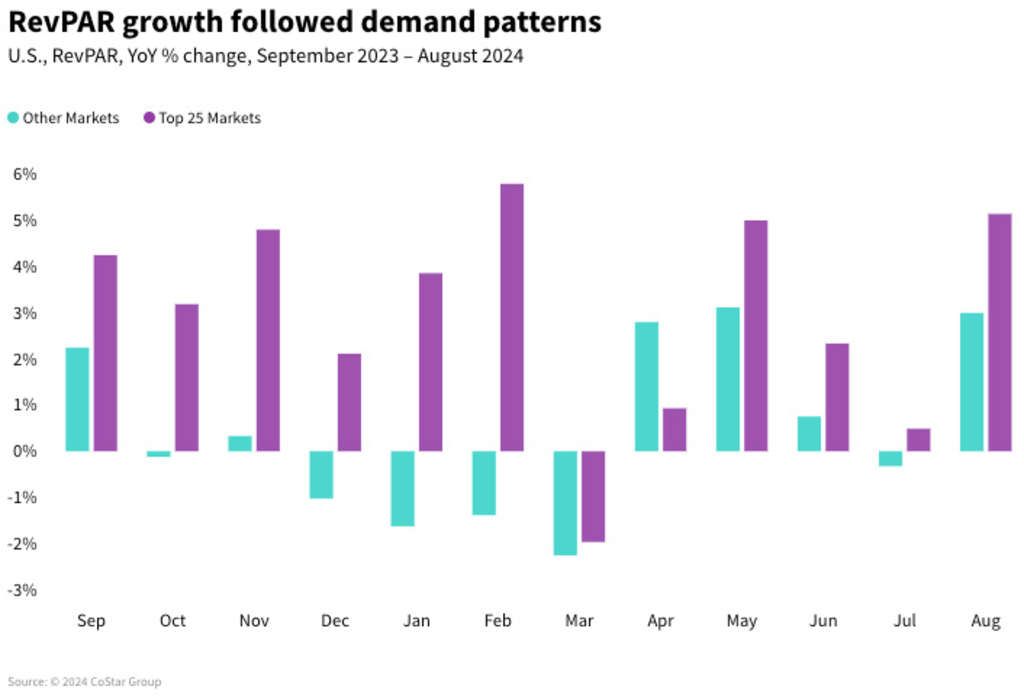
Demand growth for the Top 25 Markets (+3.2%) maintained a lead over all other markets (+1.2%), accelerating after two months of deceleration. Top 25 Market ADR growth was on par with remaining markets (+2.3%). With the stronger demand gains, RevPAR for the Top 25 Markets rose by 5.1% versus 3% for all other markets.
Occupancy in the Top 25 Markets increased 1.5ppts on shoulder days (Sunday & Thursday), 0.4ppts on weekends (Friday & Saturday), and 1.9ppts on weekdays (Monday – Wednesday). Absolute occupancy was highest on the weekend (77.5%) followed by weekdays (69.6%) and shoulder days (65.7%). The largest occupancy gap to 2019 was on weekdays (-6.4ppts) with shoulder and weekend days seeing nearly the same deficit (~3.4ppts).
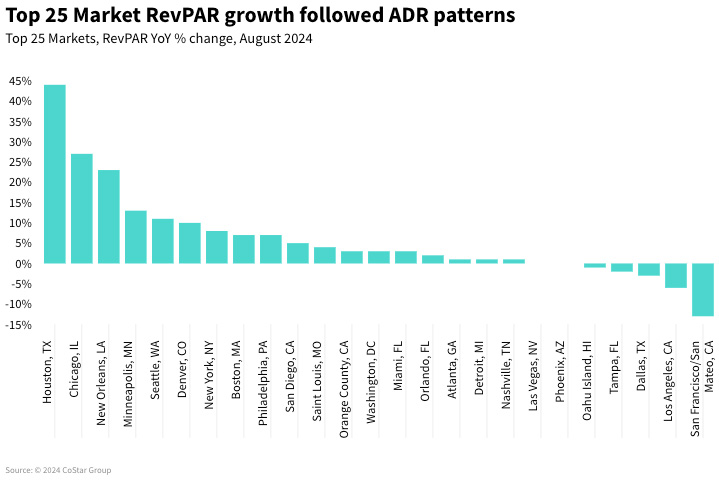
RevPAR in the Top 25 Markets was led by Houston (+44.1%), Chicago (+27.5%) hosting the Democratic National Convention (Aug 19–22, 2024), New Orleans (+23.3%), and Minneapolis (+12.7%). After a disappointing April (RevPAR decline: -3.4%), Houston has seen four consecutive months of strong RevPAR growth (+15.3% in May, +16.2% in June, +37.1% in July, and +44.1% in August). Several factors are driving Houston’s performance including but not limited to a busy events calendar as well as recovery/rebuilding efforts following widespread flooding in May and from Hurricane Beryl in July.
Pipeline
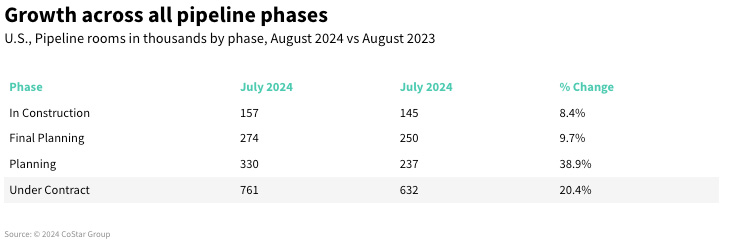
The number of rooms under construction increased for the sixth consecutive month (+8.4%). Upscale and Upper Midscale chains continued to lead in construction, accounting for nearly half of all rooms in that phase. Rooms under construction in those two segments combined to increase 3.2% as compared to a year ago. Rooms in the planning phases continued to grow with final planning up 9.7% and planning increasing by 38.9%. More than 761,185 rooms (6,405 hotels) sit in the pipeline, up 20.4% from last year.
*Analysis by Jean-Claude Pedjeu and Chris Klauda
About STR
STR is the global leader in hospitality data benchmarking, analytics and marketplace insights. Founded in 1985, STR maintains a robust global presence with regional offices strategically located in Nashville, London, and Singapore. In October 2019, STR was acquired by CoStar Group, Inc. (NASDAQ: CSGP), a leading provider of online real estate marketplaces, information and analytics in the commercial and residential property markets. For more information, please visit str.com and costargroup.com.
