STR Weekly Insights: 20-26 October 2024
Highlights
- U.S. hotels score big gains
- U.S. Group demand reaches annual peak
- Global RevPAR growth (excl. U.S.) sprints to double digits on ADR gains
- China led in demand growth, but ADR was down
- More RevPAR gains in Japan
- Strong growth in France due to markets outside of Paris
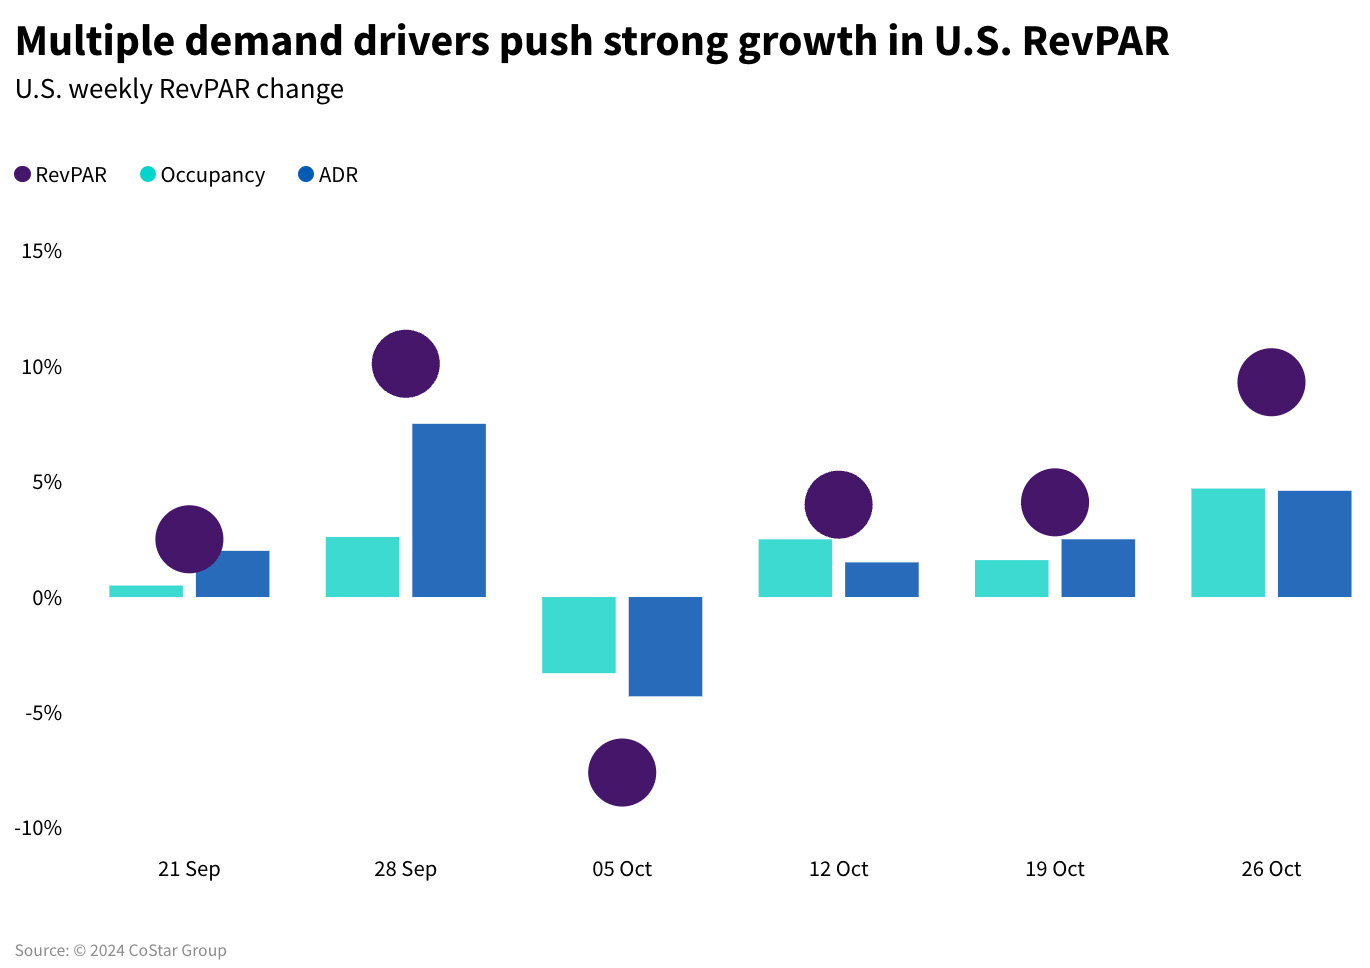
U.S. revenue per available room (RevPAR) grew 9.3% year over year on nearly equal gains in occupancy and average daily rate (ADR). Occupancy reached 69%, up 3 percentage points (ppts), and ADR increased 4.6%. The occupancy gain was the largest since earlier this year with 82% of the 171 STR-defined U.S. markets reporting occupancy growth, the most of the past 91 weeks. It was a clean week with no calendar/holiday shifts to distort the data. Ongoing hurricane recovery efforts, Taylor Swift, college football, and the squeezing in of conference/meetings ahead of Halloween and the election drove demand gains.
More than 27.2 million rooms were sold during the week, which was higher than what was sold during the comparable week in 2019 and 1.3 million more than a year ago. Nearly half of the week’s demand increase came from markets in the South. The largest demand gainers were in areas impacted by Hurricane Helene and Hurricane Milton, including Augusta, Sarasota, Florida Central South, Tampa, Columbia and South Carolina Area. Demand and RevPAR growth in these markets exceeded 20%. Even though demand was up year over year, occupancy (69%) was lower from the prior week (70%), which is normal based on the three times with the same calendar composition since 2000.
Demand was up in all regions, but with a higher ADR growth rate, the Northeast led the country again in RevPAR growth (+12.5%) followed by the Midwest (+11.9%) and the South (+10.5%) with the West trailing (+5.1%). The highest RevPAR gains in the Northeast were in tertiary markets like Rhode Island and Massachusetts Area. The three Top 25 Markets in the Northeast (Boston, New York City, and Philadelphia) saw slightly stronger RevPAR growth in aggregate (13.4%) than the remaining markets (+10.6%) due to stronger ADR gains (+9% vs. +4.6%). The ADR growth disparity between the Top 25 and all others played out across three of the four regions with the West being the exception. ADR growth for the nine western Top 25 Markets collectively was up 1% versus 3.5% for the remaining markets. The region was held back by San Francisco and Las Vegas, where ADR went backwards.
While the South saw increased demand from recent hurricanes, several of the region’s markets reported a significant lift in ADR, including New Orleans, which benefited from Taylor Swift’s Eras Tour. For the week, New Orleans ADR increased 64.1%, the most of any market. Weekend (Friday & Saturday) ADR for the market was up 147.7%, resulting in the nation’s highest weekend ADR ($489). In the days prior to the concerts (Sunday-Wednesday), New Orleans ADR was up just 0.6% YoY.
Greensboro/Winston Salem followed New Orleans with the next highest weekly ADR increase (+41.3%) with its weekend ADR up 72.3% on strong demand gains due in part to various events in the market.
College football also drove performance across the nation. Tuscaloosa saw the largest weekend RevPAR increase of any submarket with the measure rising 649.3% on a 386.3% ADR lift due to the Missouri/Alabama game. The market’s weekend ADR ($508) was comparable to that of Maui and Key West. In the submarkets that hosted a top 10 team this week, RevPAR was up 22.7% on rising ADR.
Group demand among Luxury and Upper Upscale hotels increased 7.3% after falling in the previous three weeks. Absolute demand reached its highest level of the year thus far (2.4 million), was equal to the comparable week in 2019, but below 2019’s peak, which occurred in Spring of that year. In 2023, the peak occurred a week earlier, but this year’s level surpassed it. Group demand was up across most markets and was led by Augusta. Group ADR increased by 4% in the week.
Given the strength in Group demand, it’s not surprising that Luxury and Upper Upscale hotels saw strong RevPAR growth. What is surprising is that five of the seven chain scales saw RevPAR increases above 9%. Economy (+6.9%) and Independents (+5.4%) were the only segments below that percentage. Additionally, all chain scales have posted growth in the past three consecutive weeks and in four of the past five weeks.
For the third consecutive week, New York City led the nation in absolute occupancy (92.7%) followed by Boston (89.8%). The next three highest occupancy levels were seen in cities directly or indirectly impacted by the recent hurricanes: Greenville/Spartanburg, SC (89.7%), Tampa (84.2%) and Augusta (84.1%). Midtown West/Times Square and Midtown South led submarkets in occupancy (94.1%) with two other New York submarkets claiming third and fourth place. The fifth highest submarket occupancy was seen in Nashville CBD (92.7%). This submarket has been above 90% for the past three weeks, a claim that only seven other submarkets can make, all of which are in New York.
Weekend RevPAR increased 12.2%, which was largest increase since spring with the growth evenly split between occupancy and ADR. Even if you exclude New Orleans, weekend RevPAR was strong (+10.3%), meaning Taylor Swift drove nearly two percentage points of the U.S. weekend RevPAR gain. RevPAR on weekdays (Monday-Wednesday) and shoulder days (Sunday & Thursday) increased 7.4% and 8.9%, respectively.
Global hotels sprint ahead
Global RevPAR, excluding the U.S., advanced 10.2% mostly on ADR gains (+7.2%). Occupancy increased nearly two percentage points to 72.6%, with the level almost the same as it was a week ago. Weekdays and shoulder days produced the largest RevPAR increases, each in double-digits, with ADR showing no variation between the day types. Weekend RevPAR, while lower than the other day types, was still formidable, rising 8%--like its growth in the prior week. Global RevPAR including the U.S. still increased 9.9%.
Demand outside the U.S. increased by more than 3.3 million rooms with 75% of countries seeing growth, led by China, which accounted for more than a fifth of that gain. Nearly half of the demand growth came from the top 10 largest countries including Canada, France, Germany, Japan, Spain, and the United Kingdom.
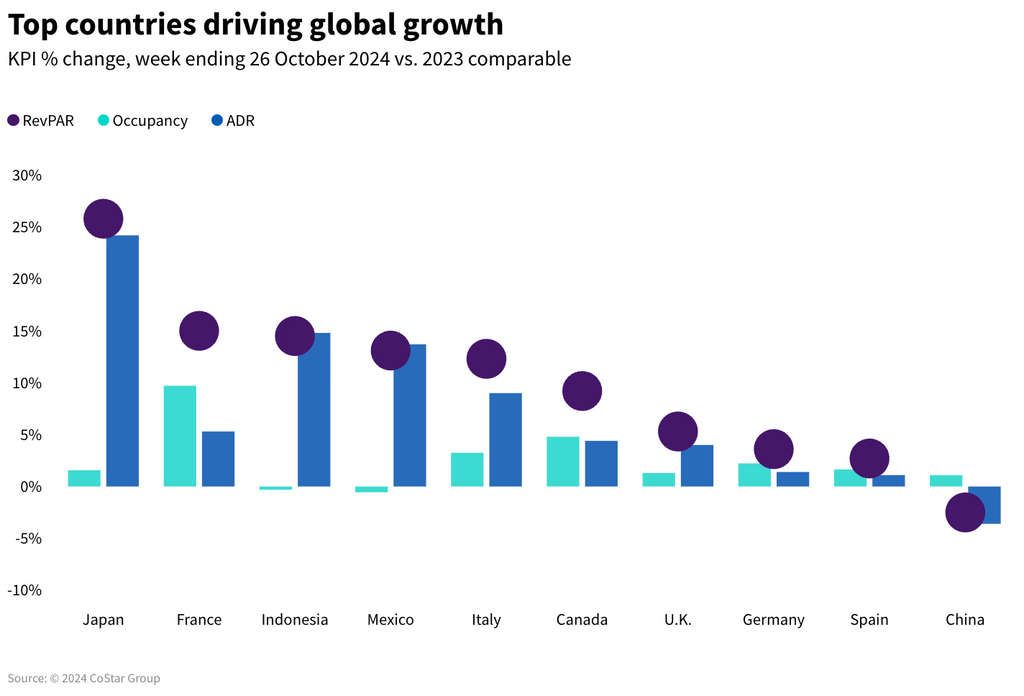
Strong RevPAR growth was seen in Japan, led by Kyoto and Tokyo, each seeing gains of more than 30%. France also had strong RevPAR growth driven by markets outside of Paris. Paris, which accounts for most of the weekly sample, was up 4.3%, all on occupancy as ADR went backwards. Mexico continued to see ADR-driven RevPAR increases. RevPAR in the Mexican Caribbean, which has the most rooms of any market in the region, saw RevPAR move up 10.1% on a 16.8% ADR increase. Canadian RevPAR returned to positive territory (+9.2%) after the Thanksgiving slowdown in the previous week.
While China led the globe in room demand growth, RevPAR for the week fell 2.5% as ADR dropped 3.6%. Double-digit ADR decreases were seen in Fuzhou, Hainan, Hong Kong, Qingdao, and others. Occupancy in China stood at 72.6% and has been above 70% in three of the past four weeks.
Final Thoughts
Travel compression ahead of Halloween and the election along with key college football matchups and fall travel drove strong demand in the week and will lead to a solid RevPAR month. While driven by different factors, global results showed similar results. Looking ahead, the next two weeks will be much different in the U.S. given Halloween and the election. We expect to see positive RevPAR comparisons in November, but much less than what is predicted for October. The rest of the world will also see a slowing in performance in the coming week, ending 2 November 2024, with acceleration in the following one.
*Analysis by Isaac Collazo
About CoStar Group, Inc.
CoStar Group (NASDAQ: CSGP) is a leading provider of online real estate marketplaces, information, and analytics in the property markets. Founded in 1987, CoStar Group conducts expansive, ongoing research to produce and maintain the largest and most comprehensive database of real estate information. CoStar is the global leader in commercial real estate information, analytics, and news, enabling clients to analyze, interpret and gain unmatched insight on property values, market conditions and availabilities. Apartments.com is the leading online marketplace for renters seeking great apartment homes, providing property managers and owners a proven platform for marketing their properties. LoopNet is the most heavily trafficked online commercial real estate marketplace with over twelve million monthly global unique visitors. STR provides premium data benchmarking, analytics, and marketplace insights for the global hospitality industry. Ten-X offers a leading platform for conducting commercial real estate online auctions and negotiated bids. Homes.com is the fastest growing online residential marketplace that connects agents, buyers, and sellers. OnTheMarket is a leading residential property portal in the United Kingdom. BureauxLocaux is one of the largest specialized property portals for buying and leasing commercial real estate in France. Business Immo is France's leading commercial real estate news service. Thomas Daily is Germany's largest online data pool in the real estate industry. Belbex is the premier source of commercial space available to let and for sale in Spain. CoStar Group's websites attracted over 183 million monthly average unique visitors in the second quarter of 2024. Headquartered in Washington, DC, CoStar Group maintains offices throughout the U.S., Europe, Canada, and Asia. From time to time, we plan to utilize our corporate website, CoStarGroup.com, as a channel of distribution for material company information. For more information, visit CoStarGroup.com.


