Market Recovery Monitor - 21 May 2022
Occupancy in the U.S. reached 68.6% for the week of 15-21 May 2022, which was the highest level since July 2021. To add some perspective, since the start of the pandemic, weekly occupancy has only surpassed 65% on 17 occasions with seven of the occurrences happening this year and the remainder seen last summer. Furthermore, year-to-date occupancy is 60% versus 51% a year ago. Weekly average daily rate (ADR) advanced to US$152, the third highest level of the pandemic-era and 13% higher than the comparable week of 2019. More importantly, revenue per available room (RevPAR) reached its highest level (US$104) since the start of the pandemic.
For the second consecutive week, New York City led the nation in occupancy (89.4%), powered by graduation ceremonies for Columbia University’s and New York University’s classes of 2020, 2021 and 2022. This was also the city’s highest occupancy of the pandemic-era. In total, 18 markets reported their highest occupancy levels since the pandemic began, including San Francisco (79.0%), Boston (77.3%), Seattle (76.2%), Washington, D.C. (76.1%), Chicago (71.5%), Philadelphia (69.8%), and Minneapolis (63.9%).
Seventy percent of reporting hotels saw occupancy surpass 60% during the week—the most since summer last year. Of the 600 large (300+ rooms) urban location hotels, 80% had weekly occupancy above 60%. Of those hotels, 42% reported occupancy above 80%, which was the most since the beginning of the pandemic.
Weekday (Monday-Wednesday) occupancy, a barometer for business travel, increased to 67.2%, which was the highest of the year and the fourth highest since the start of the pandemic. Among the Top 25 Markets, weekday occupancy (72.2%) was the best since March 2020, with group demand the second highest. The Top 25 Markets also saw their highest weekday ADR (US$184) and RevPAR (US$133) of the pandemic-era. Eight of the Top 25 Markets, including New York City, Chicago, San Francisco, and Washington, D.C. also reported their highest weekday occupancy of the pandemic era led by NYC (91.1%) and San Francisco (82.7%). Fourteen of the Top 25 Markets saw weekday occupancy surpass 70%, the most since the pandemic began. Nearly half of large urban hotels reported weekday occupancy above 80%, which was again the most in the pandemic-era
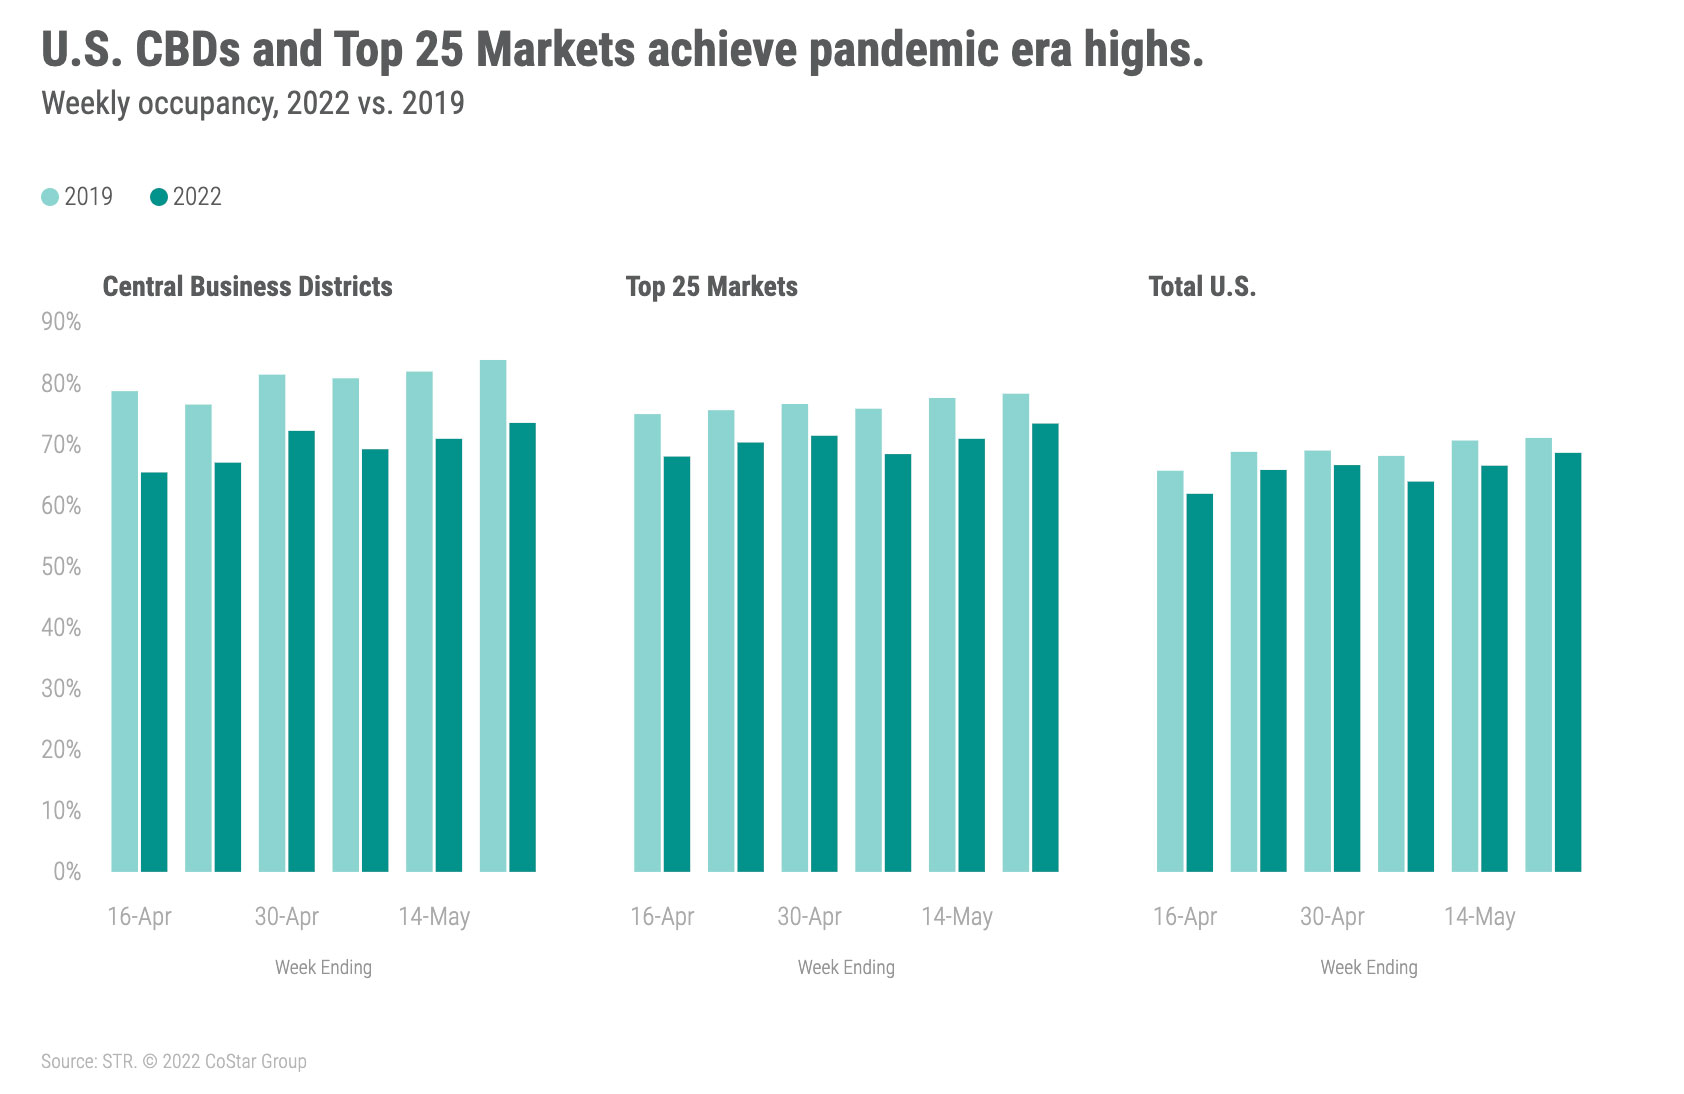
Strong occupancy also prevailed in central business districts (CBDs), where weekly occupancy topped 73%, which was the highest level of the past 27 months. Along with strong occupancy, ADR (US$244) and RevPAR (US$180) also reached a pandemic high. Five of the 20 CBDs tracked reported occupancy above 80%, led by the New York Financial District (92%), which we include with the 19 other CBD submarkets. Weekday CBD occupancy was the same as the weekly total with New York Financial District reaching 94.5%, which was the highest level for the submarket since late 2019. Thinking of business demand through the chain scale lens, luxury (72.2%), upper upscale (72.3%) and upscale (74.6%) hotels reported their highest occupancy since the start of the pandemic.
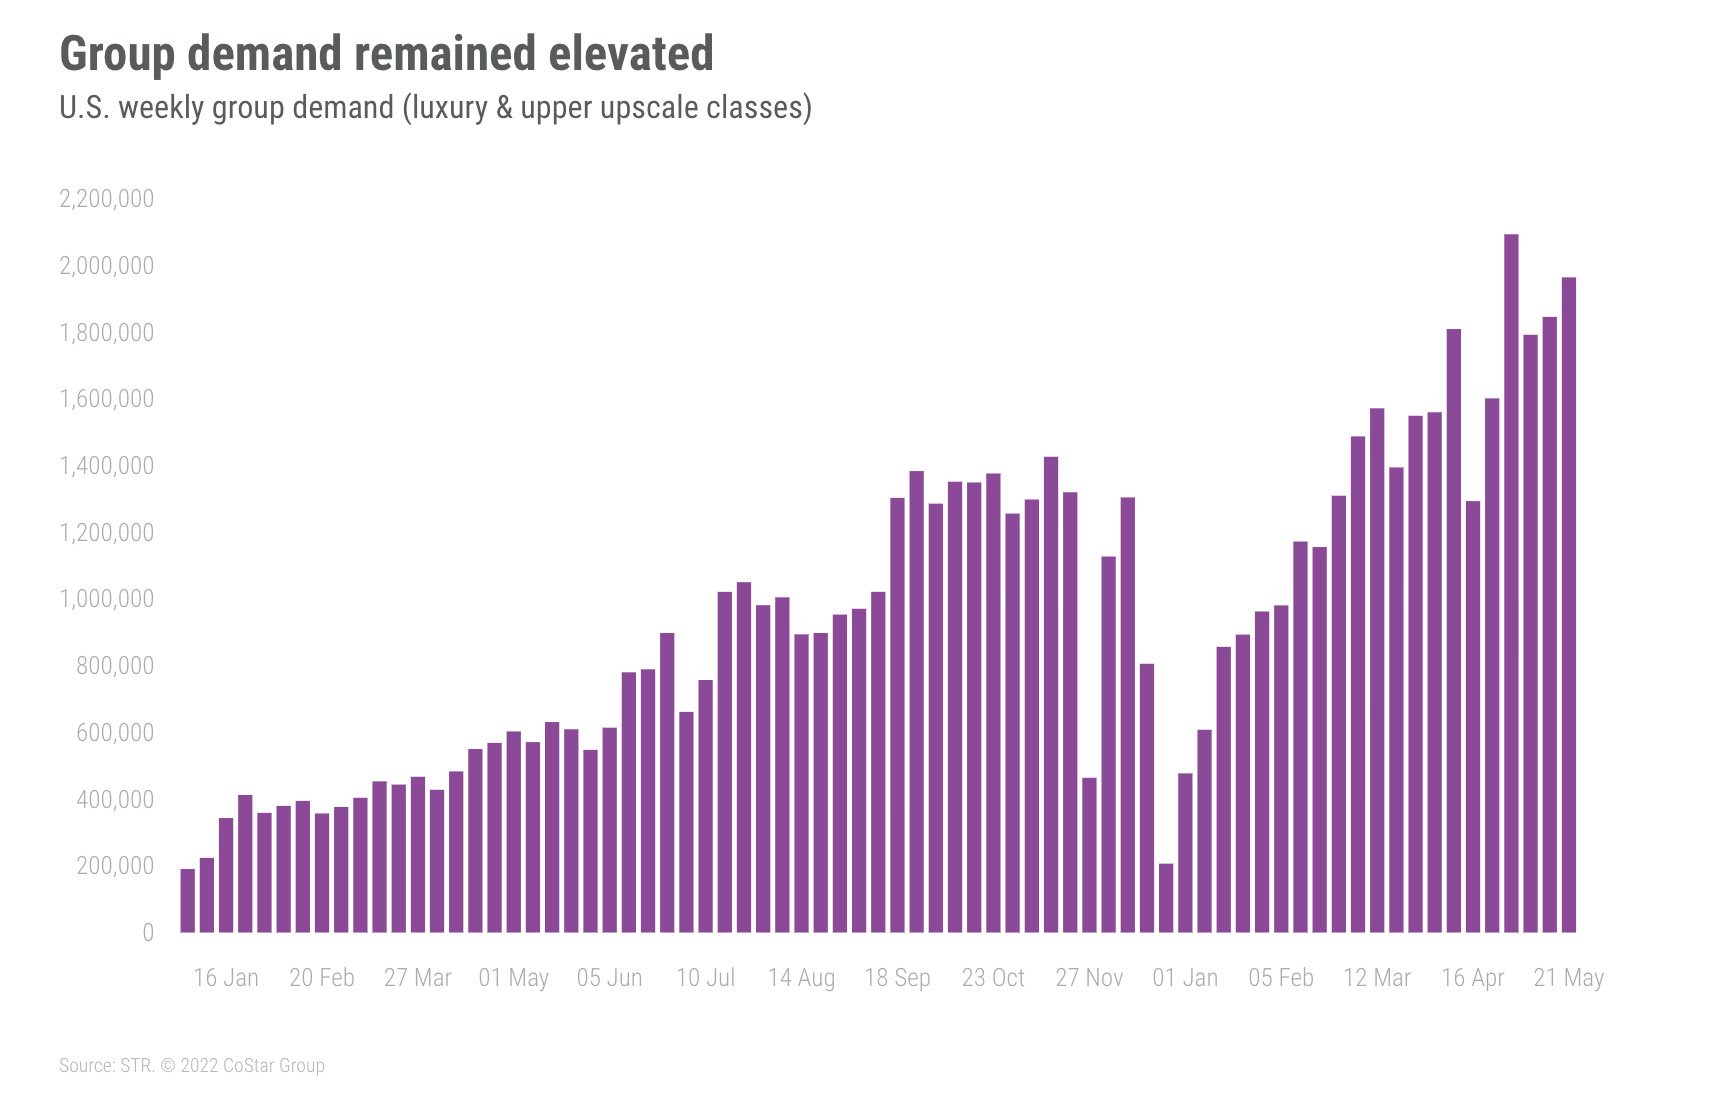
Group demand strengthened among luxury and upper upscale hotels with this week’s amount the second best of the pandemic era. This was the fourth week of elevated group demand with the weekly total at 97% of the comparable week of 2019. Weekday group demand was 86% of 2019’s level with weekend group demand surpassing 2019 by 22%. Group RevPAR also surpassed 2019 for the second time, however this most recent week’s attainment was more significant given its high volume. When group demand previously surpassed 2019, the volume was low and based on holiday groups.
Weekend occupancy was 77.8%, which was the second best of the year and the 12th highest of the pandemic-era. Again, New York City led the nation with the highest weekend occupancy (91.2%) followed by Long Island. While occupancy was not a record, weekend RevPAR (US$131) reached a pandemic-era high as ADR was the second best.
Nominal ADR remained strong with this week’s result 13% above the comparable level from 2019 and the third highest of the pandemic era. Week on week, hotel room prices increased 2.2%, the largest gain of the past 6 weeks. Top 25 Markets reported their highest ADR of the era (US$184) as did CBDs (US$244) along with upscale (US$159) and upper midscale hotels (US$131).
Inflation has increased by about 13% this year as compared with the same period in 2019. Forty-five percent of hotels that were open in 2019 and are still open today reported ADR growth that was above the rate of inflation with 28% seeing ADR growth of more than 20% from 2019. However, there are still hotels that are suffering. Twenty-five percent saw lower ADR when compared to the same week in 2019. The percentage of hotels with negative ADR change was slightly lower this week than what it has been for most of this year. On an inflation-adjusted basis, real industry-wide ADR was essentially at 2019’s level and has been there or above 2019 for the past 10 weeks.
Nominal RevPAR was the highest it has been since the start of the pandemic in nearly every cut of the data. Therefore, it is not surprising that 79% of the 166 STR-defined markets were in the “peak” category (RevPAR indexed to 2019 above 100) with the remaining markets, except one, in “recovery” (RevPAR indexed to 2019 between 80 and 100). On an inflation-adjusted basis, 41% of markets were in “peak” with 53% in “recovery.” Taking a longer view (rolling 28 days), 37% of markets had real RevPAR at “peak” with another 53% in “recovery.”
Around the Globe
Outside of the U.S., occupancy increased 2.6 percentage points from the prior week to 62.8%. ADR grew 0.6% to US$124, resulting in a 4.9% RevPAR gain. Only 26 of the countries tracked on a weekly basis saw a week-over-week drop in occupancy, which was a significant improvement compared with previous weeks.
Occupancy in Kuwait gained 15 percentage points, likely driven by a sandstorm sweeping the region and resulting in the cancellation of numerous flights. The Czech Republic also saw strong growth with occupancy up 9.3 percentage points, driven by the lifting of all COVID restrictions. China was up three percentage points to 48.9%, sitting 24.1 percentage points behind the comparable week in 2019. While a proportion of occupancy can be attributed to demand related to COVID, there were positive signs in Shanghai, which is set to reopen 1 June.
Ireland again achieved strong occupancy levels (85.2%) as Dublin reached 90.4%. The market is consistently reporting high occupancy levels, especially during the weekend, with each Saturday night at more than 93%. Northern Europe saw the highest occupancy (78.5%) of any sub-continent, up 1.6 percentage points from the week prior, with Northeastern Asia reporting the lowest level (49.7%).
From a market perspective, Corsica/Provence-Alpes-CDA occupancy showed an 11.9 percentage-point increase, and ADR rose 106% due to the Cannes Film Festival. Unfortunately, Western Cape saw a 15.6 percentage-point decrease in occupancy due to an increase in COVID cases.
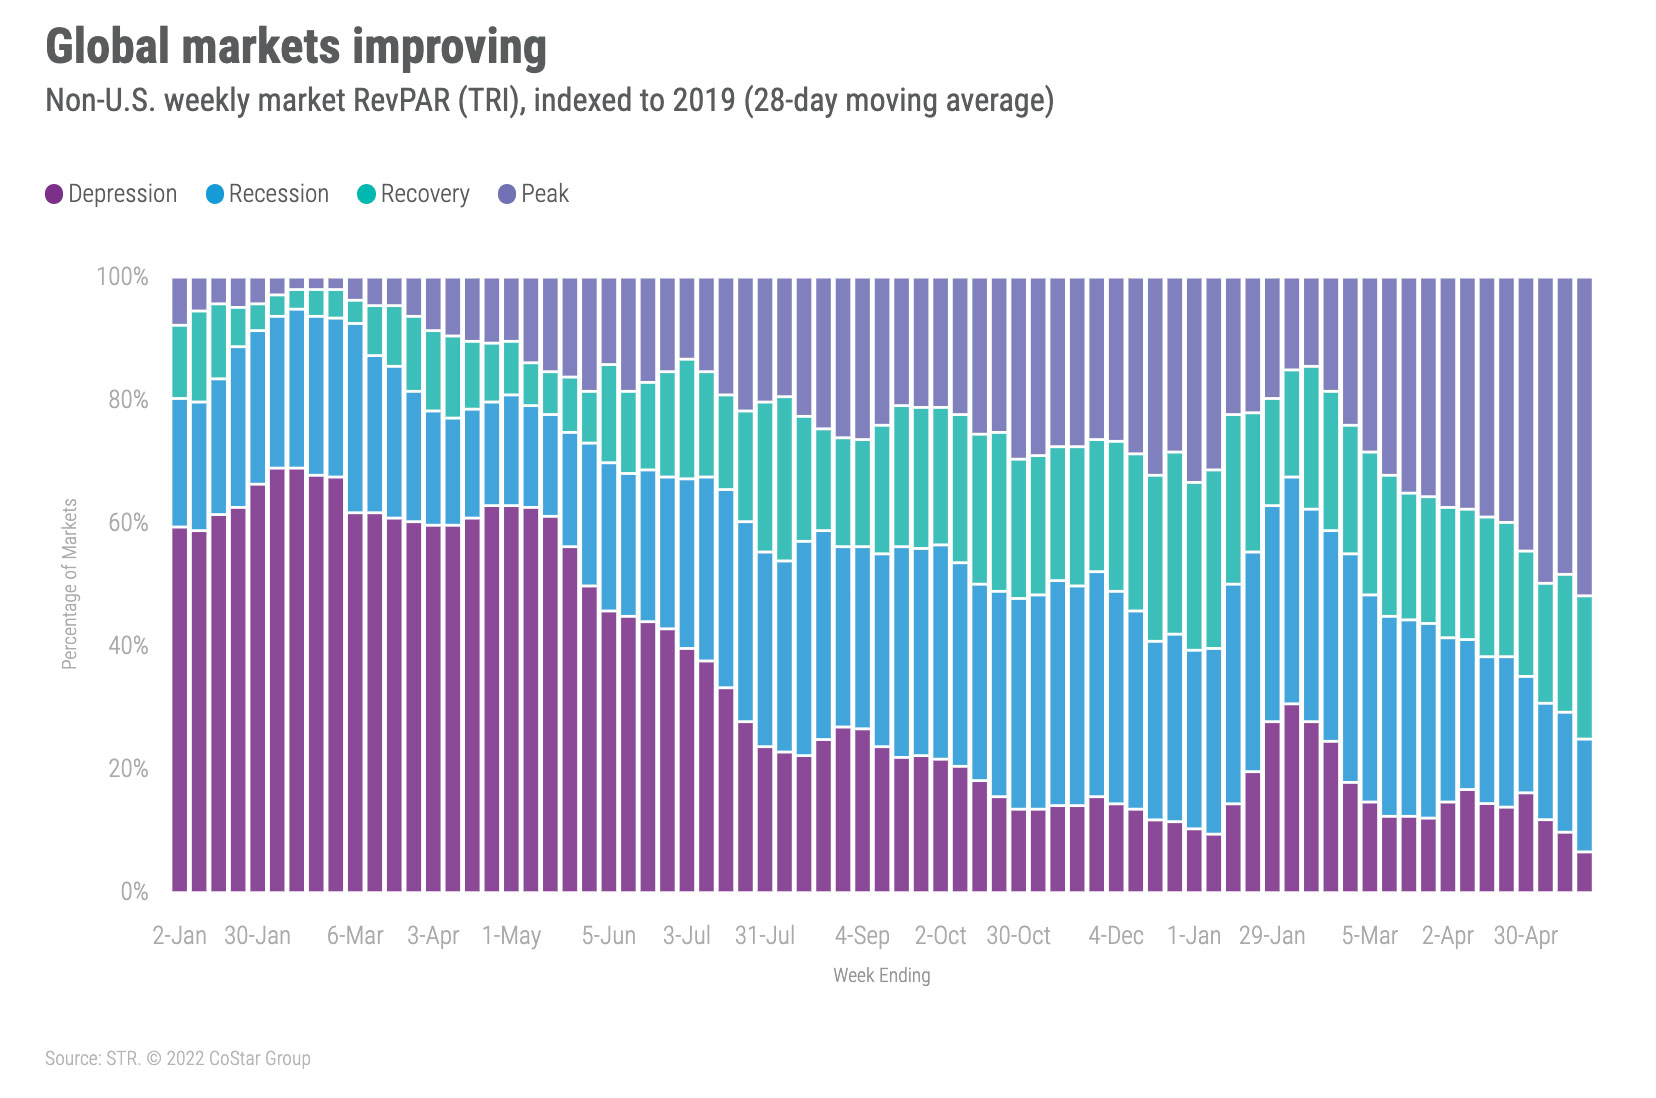
Over the past 28 days, 18% of global markets remained in “Recession” (RevPAR indexed to 2019 between 50 and 80) with another 6% in “Depression” (RevPAR indexed to 2019 under 50). This is, however, an improvement compared with previous weeks. As numerous regions enter the summer leisure season and remove the majority of COVID restrictions, we expect to see better market performance.
Big Picture
This was a solid week for the industry driven by increased group and business travel, graduations, and elevated leisure trips. Leading indicators point to another strong week ahead of the Memorial Day holiday in the U.S. TSA security screenings for the seven days ending Thursday, 26 May 2022, was at 93% of the pre-pandemic comparable, which is the highest seven-day percentage of the pandemic era. As was said at the Hunter Hotel Investment Conference all the way back in March, this summer is on the verge of being “the summer of summers.”
NOTE: Weekly data processing will occur a day later next week in observance of the Memorial Day holiday. We will do our best to post the next version of the Market Recovery Monitor at the usual time, but there may be a slight delay. Thank you for your patience.
About STR
STR provides premium data benchmarking, analytics and marketplace insights for the global hospitality industry. Founded in 1985, STR maintains a presence in 15 countries with a corporate North American headquarters in Hendersonville, Tennessee, an international headquarters in London, and an Asia Pacific headquarters in Singapore. STR was acquired in October 2019 by CoStar Group, Inc. (NASDAQ: CSGP), the leading provider of commercial real estate information, analytics and online marketplaces. For more information, please visit str.com and costargroup.com.


