The Best Seat in the House is a Cheap Seat
If you were to travel to see your favorite musical act in any city in the US, which city would you choose? How would you decide? Would you want to travel somewhere with a famous music scene, a fun destination with things to do and good infrastructure, or look for the cheapest ticket you can find? We know from previous HVS analysis that many fans are willing to travel, but that not all concert tour destinations have the same appeal. Why do different stadiums or cities get more visitors and associated imported economic impact than others?
To answer this question, we gathered data from Pollstar on four large domestic tours from 2022-2023: Taylor Swift’s Eras, Beyonce’s Renaissance, Ed Sheeran’s Mathematics, and Elton John’s Farewell Yellow Brick Road. From 2022 through August 2023, at least three tours in seven different US venues overlapped. We used the tour dates to gather the percentage of attendees from more than 100 miles away at each performance from Placer.ai. Placer.ai uses phone tracking data from third-party apps to count attendees at an event and track their origin and from how far away they came.
We focused on tourists, which we define as people who come to concerts from more than 100 miles away because they import spending and generate new economic impact, as opposed to local attendees who already spend in the local economy. Venues that attract more tourists import have a larger economic impact.
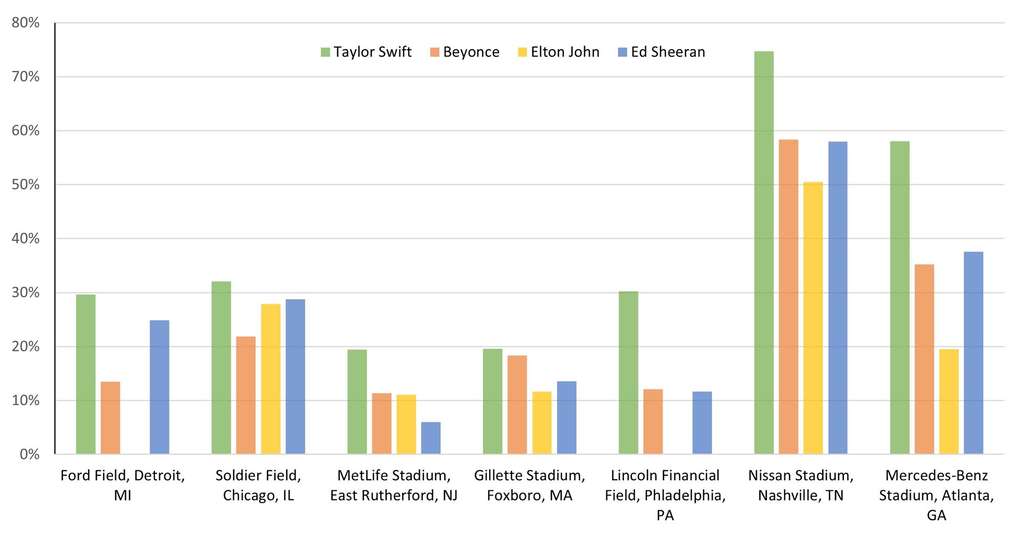
The figure below shows the percentage of tourists for each tour in the seven cities, with at least three of the tours overlapping.
Percentage of Tourists at Each Tour
There is some variation by tour: Taylor Swift attracts the most tourists, while Elton John attracts the fewest, although Elton John did not play at Ford Field or Lincoln Financial Field on his tour. But more significantly, Nashville stands out as a magnet for tourist concert attendees, with more than half of attendees being tourists for all four tours. Far more than MetLife Stadium in the New York metro area (12%) and Gillette Stadium outside Boston (16%).
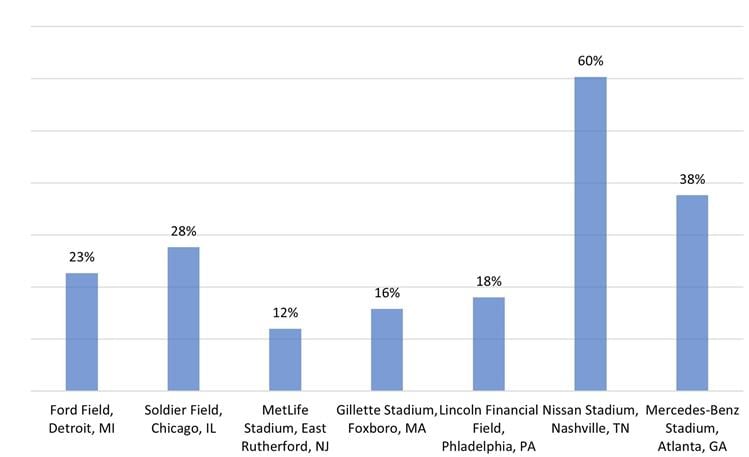
The figure below shows the average percentage of attendees who are tourists across the overlapping tours.
Average Percentage of Tourists
The self-proclaimed Music City is the clear leader. More than half of Nissan Stadium was full of concert attendees who traveled to Nashville, stayed at hotels, ate, drank, and shopped. Atlanta gets the second most travelers, with 38% of their concert attendees, followed by Chicago with 28% and Detroit with 23%. The New York, Boston, and Philadelphia metro areas get the fewest attendees from over 100 miles, below 20% on average.
What accounts for the strong tourist draw of Nashville and Atlanta? Is it because they are popular music destinations or especially attractive cities to tourists?
To judge the quality of a city’s music scene, HVS used research from Clever Real Estate [1]. They used data from the US Census, the Bureau of Economic Analysis, the Bureau of Labor Statistics, and Indie on the Move to compare cities based on Google trends, the number of musicians, the cost of tickets, and the availability of concert venues to rank the top music scenes in the country. The table below shows the ranking of each of the seven cities identified below and the average percentage of attendees from more than 100 miles away.
Music Scene Ranking
While Nashville’s music scene ranks first in the country due to its large population of musicians and higher wages for musicians, Atlanta only ranks 45th, well behind northeastern hubs Boston and Philadelphia. New York and Chicago ranked relatively low due to the high cost of living and cost of concert tickets. There is no clear indication that having a vibrant and successful music scene attracts more tourists to a city to see a concert. Other city attributes may drive concert tourism.
To measure the quality and attractiveness of a city, a potential decision factor for a traveling concert attendee, HVS used Resonance Consulting’s ranking of the best cities in the United States. Resonance produces these rankings annually and uses a methodology that evaluates a city in six categories: place, product, programming, people, prosperity, and promotion. This includes the quality of the natural and built environment, the city's key institutions and attractions, and the city's art, culture, entertainment, and culinary scene, among other considerations.
The table below shows the Resonance Best City rankings alongside the average percentage of tourists across tours.
City Quality Ranking
New York, Chicago, and Boston lead the way in the Resonance city ranking despite having a relatively low percentage of tourists attending their concerts. Nashville, the leading tourist hub for concert attendees, ranks 28th, and Atlanta ranks 12th.
Like the music scene ranking, the Best Cities ranking does not correlate with the percentage of concert tourists. If people are not coming to a city for a concert because of the music scene and not because of the city’s allure, culture, and infrastructure, why do they travel to Nashville and Atlanta for a concert, not New York, Boston, or Philadelphia?
The simple answer follows from the laws of supply and demand. Market areas with fewer people and less disposable income allow tourists to pay less to attend these concerts than they would at home. Matching data on the population and income with the percentage of concert-going tourists supports our hypothesis.
Tickets are scarcer in larger markets than in smaller markets. The northeastern markets are much more populous than Nashville and Atlanta, so there is more local competition for tickets once they go on sale. The table below shows the total population within 100 miles of the city at each venue.
Population Ranking
New York and Philadelphia have more than 30 million people, substantially more competition for tickets than the smaller markets. Nashville has the fewest people within 100 miles among the cities studied, with less than half the people within 100 miles as Detroit, the next largest market. Atlanta is marginally ahead of Detroit and one-third of the size of Philadelphia and New York. Boston is the outlier among the three northeastern cities, with only 11.6 million people within 100 miles.
The median household income is also higher in the Northeast, so more disposable income is available for entertainment. High demand pushed ticket prices higher. The table below shows the median household income for the area 100 miles from the city.
Median Household Income Ranking
Nashville and Detroit are in the bottom three of median household income, while the three northeastern cities are in the top 3 of median household income. This extra disposable income makes it easier for people from the northeast who couldn’t get tickets to their local show to buy tickets and travel to Nashville or Atlanta.
A comparison of average ticket prices reinforces our point about people paying lower ticket prices in these tourist destinations. The ticket prices at the venues in Nashville and Atlanta are the lowest among the venues we analyzed. The table below shows the average ticket price at each venue.
Average Ticket Price at Each Venue
Ticket prices at Atlanta and Nashville venues are more than $15 less than Philadelphia, which is the next lowest. New York and Boston are the second and third most expensive venues, at or above $150 per ticket. The lack of competition for the tickets and limited market size makes tickets in Nashville and Atlanta cheaper and easier to get than in larger, more populous areas like the Northeast.
When given the choice of where to travel for a concert, fans of Elton John, Beyonce, Taylor Swift, and Ed Sheeran predominantly choose to travel where tickets are available and inexpensive. Fans may appreciate the local music scene or the amenities a destination may have to offer, but when it comes to finding a place to watch a concert, the availability of tickets and cost remains the primary driver.
[1] Clever, The Best Music Cities in the U.S. (2022 Data), Retrieved August 28, 2023.


