The Road to Hotel Profitability: Adopting Flow Through + Flex Metrics

When measuring hotel profitability, two key metrics stand out: flow through and flex. Flow through measures the percentage of additional profit from each extra dollar of revenue, while flex gauges the ability to save profit during revenue shortfalls. These metrics provide crucial insights into financial performance, offering a comprehensive framework for operational analysis. Understanding flow through and flex is essential for any hotel aiming to optimize profitability and navigate economic fluctuations effectively,
says Lisa Martin, Regional Director for Hotel Finance, at Davidson Hospitality. Integrating these metrics into your analysis toolkit can unlock the secrets to maximizing profitability.
Simplifying the Calculations
Don't be intimidated by the calculations—determining flow through and flex is straightforward. All you need are the total revenue and gross operating profit (GOP) figures for two distinct time periods.
The Flow Through Formula

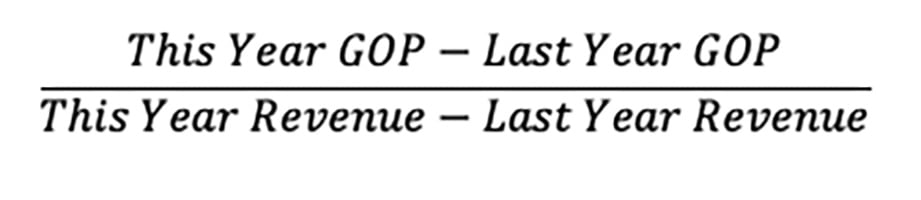
The sign of the Flow Through percentage tells us whether GOP changed in the same direction as revenue, and the number or absolute value measures the magnitude of the change in GOP in relation to the change in revenue.
The Flex Formula

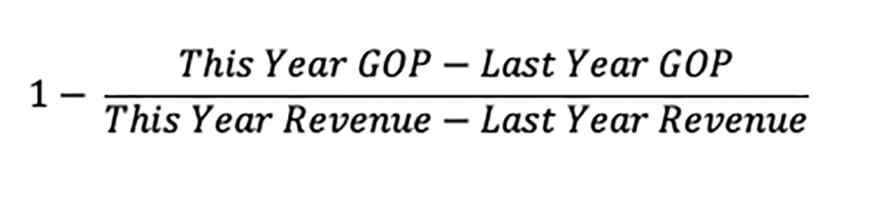
Flex is 1-Flow Throughbecause we are not interested in how much of the loss in revenue was translated into a loss of profitability, but rather how much we were able to keep in our profits despite the fall in revenue.
Flex can be thought of as one minus flow through because, in this scenario, we are not interested in how much of the loss in revenue turned into a profit decrease, but rather how much we were able to save despite the fall in top line.
Decoding Flow Through
Flow through primarily revolves around revenue increases. To decipher the results effectively, two key components demand attention: the sign and absolute value.
The sign of the flow through percentage reveals whether the GOP changed in the same direction as revenue. A positive sign indicates an increase in GOP, while a negative sign signifies a decrease.
The absolute value of the flow-through percentage gauges the magnitude of the change in GOP relative to the change in revenue. If the absolute value exceeds 100 percent, it suggests that the GOP overreacted, with profit changes surpassing revenue changes. Conversely, if the absolute value falls below 100 percent, it implies that the GOP underreacted, with profit changes trailing behind revenue changes.
Flex comes into play when revenue experiences a decline. Remember, flex calculation involves two primary components: (1) "1 -" and (2) "flow through." The sign of the flow-through term offers insights into whether GOP responded in the same direction as revenue. If it is positive, it means GOP decreased alongside revenue, while a negative sign implies that GOP increased despite the revenue loss. Combining this with the "1 -" term, we discover that flex will be less than 100 percent when GOP decreases (aligning with revenue) and greater than 100 percent when GOP increases (moving counter to revenue).
Consider this analogy: Suppose revenue declined by $100, and GOP fell by $100 as well. In this case, flex would be 0 percent, indicating that no lost revenue was saved as profit. However, if GOP dropped by $90, it means that $10 was preserved as profit, resulting in a flex of 10 percent. As the change in GOP approaches $0, flex reaches 100 percent, implying that all lost profits have been recouped. Moreover, flex percentages exceeding 100 percent account for instances where GOP increased despite revenue declines.
But what role does the sign of the flex percentage play? While it does not indicate a direction, a negative flex percentage signifies that the decline in GOP exceeded the revenue shortfall. This suggests that no portion of the lost revenue was recuperated as profit, and unfortunately, profits continued to decline beyond the revenue crunch.
Cracking the Profitability Code
Flow through and flex hold tremendous value as they encapsulate both top-line changes and the effectiveness of cost controls in safeguarding the bottom line. A higher flow-through percentage signifies a hotel's ability to manage costs effectively during periods of business expansion. On the other hand, a higher flex percentage indicates operational flexibility and the ability to identify cost-saving opportunities during economic downturns.
Discover the full potential of your operation. What is your hotel's typical flow through and flex percentages? Have you set specific goals for these metrics? How do they compare to your competitors? If you are uncertain, embrace the framework provided above to embark on a journey of profitability analysis, adding a new layer of insight to your operational performance assessment. Visit HotStats for more insights and tools to help you crack the profitability code within your hotel’s financial landscape.
About HotStats
HotStats, a Duetto company, is a global data benchmarking company offering specialized performance analysis and a benchmarking tool that helps analyze financial and operational data from a diverse range of hotels globally. This provides hotel owners, operators, and investors with valuable insights into the financial performance of their properties against their competition – an invaluable resource for weighing options and evaluating investment opportunities. For a quick demo, email us at [email protected] or visit www.hotstats.com.