Hotel F&B driving labor cost growth in 2024
In the U.S., it costs about $9 more to staff a hotel room than in 2023.
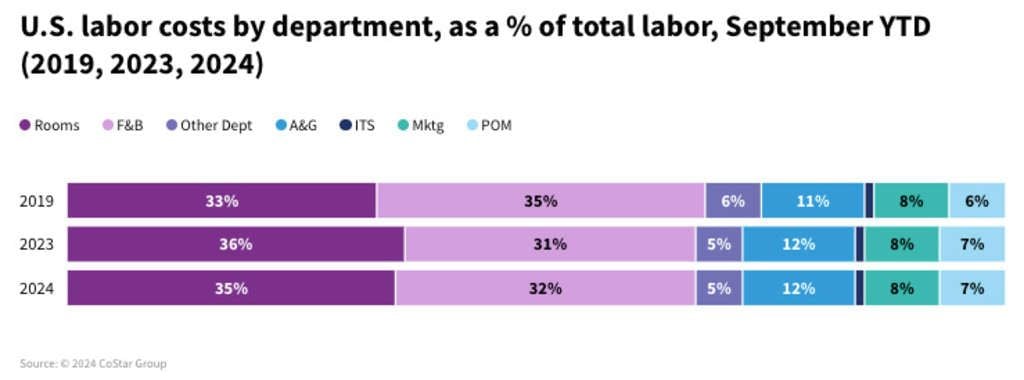
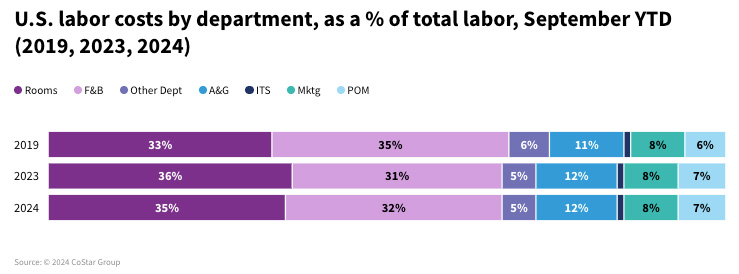
While rooms labor (housekeeping, front desk staff) makes up the highest portion of staffing expenses, the increase in food and beverage (F&B) labor costs is driving most of that growth. F&B labor costs have seen a growth of nearly 15% in 2024, outpacing all other departments. Given that food banquet and catering revenues are one of the strongest types of F&B revenue in terms of growth, it makes sense that staffing would increase to accommodate this drive in traffic.
Groups have direct impact on F&B
The evolving group performance seen this year has had a direct impact to hotel F&B, given the need that events, meetings, conferences, etc., have when held on the property. Groups have performed the strongest of any segment in the U.S. most recently, with demand +3.5% through September year to date (YTD).
Even more notable is the growth group rates have seen in the U.S. The segment has seen a 3.8% rise in room rates during 2024, compressing the gap between transient. The increasing presence of this segment is aiding the growth and recovery of food and beverage revenue per occupied room (POR). F&B revenues POR have nearly recovered to 2019 levels, increasing from last year. In other words, the F&B spend by guest is improving, and with that growth, the distribution of labor costs is shifting back towards ratios seen in 2019, with the share of F&B labor increasing – up to 32% of total labor costs.
Wages vs. benefits
At a more granular level, F&B labor costs can be broken down by wages versus benefits. Benefits are inclusive of related payroll taxes, supplemental pay, and other items such as sick pay, vacation, or health insurance. Prior to the more robust group demand seen recently, we saw more hotels employ contract labor for the F&B department. However, it appears this is shifting back towards the employment of full-time F&B department staff, which is reflected by an increase in benefit expenses. The wages side, however, has not posted the same level of growth, which is largely due to the higher expense that contract labor imposes.
Labor costs (YTD)
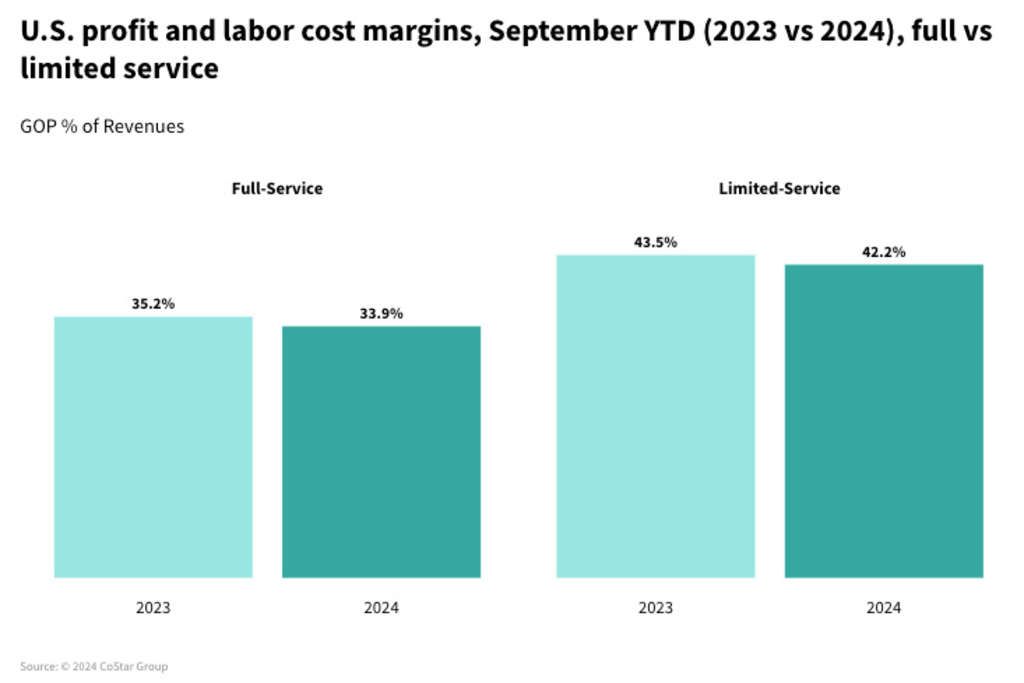
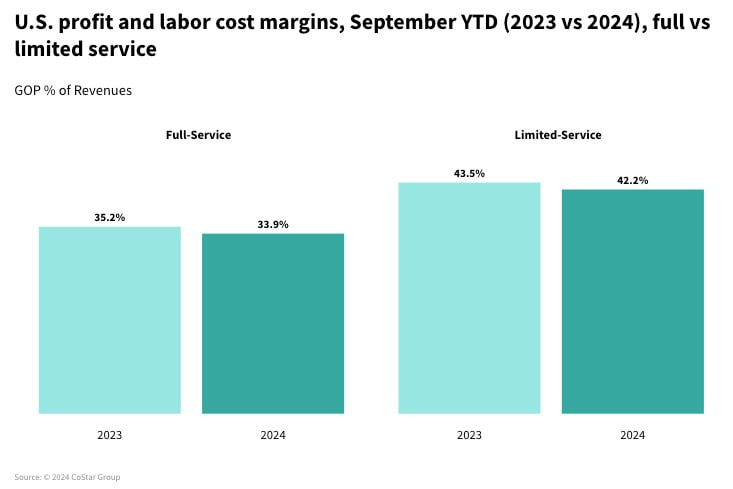
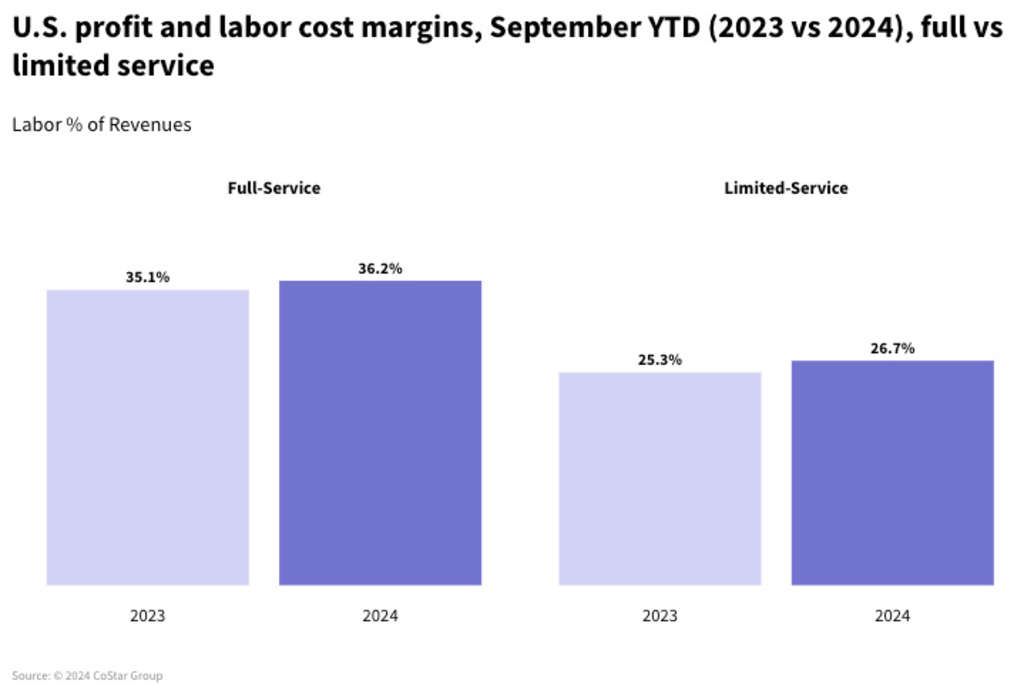
On a YTD basis, labor costs per available room (LPAR), are up 11%. That growth is putting pressure on the bottom line, and inhibiting profit increases despite a rise in total revenues. Throughout 2024, there has not been a single month that has posted less than 6% LPAR growth year over year, with some months growing labor costs by 16% (such as April). As of September 2024, gross operating profit per available room (GOPPAR) has declined year over year (YoY) during one-third of the months so far this year. Given the inverse relationship between labor costs and profits, profit margins have decreased YoY to 35.4% for the total U.S., while labor costs margins have grown over 1 percentage point to 34.4%.
Across the Top 25 Markets, more than a quarter hold a group rate premium over transient rates, with urban locations within these major markets driving much of the growth. To accommodate these groups, hotels are employing more labor – specifically within the food and beverage departments, to accommodate the events that come with these groups. Therefore, urban locations have seen the highest YTD growth in LPAR, at 10.8%.
Looking ahead
While labor costs as a percentage of revenues has grown year over year, there is a positive on the horizon: STR forecasts labor cost growth to soften in 2025, allowing improvement in profit margins.
*Analysis by Audrey Kallman.
About CoStar Group, Inc.
CoStar Group (NASDAQ: CSGP) is a leading provider of online real estate marketplaces, information, and analytics in the property markets. Founded in 1987, CoStar Group conducts expansive, ongoing research to produce and maintain the largest and most comprehensive database of real estate information. CoStar is the global leader in commercial real estate information, analytics, and news, enabling clients to analyze, interpret and gain unmatched insight on property values, market conditions and availabilities. Apartments.com is the leading online marketplace for renters seeking great apartment homes, providing property managers and owners a proven platform for marketing their properties. LoopNet is the most heavily trafficked online commercial real estate marketplace with thirteen million average monthly global unique visitors. STR provides premium data benchmarking, analytics, and marketplace insights for the global hospitality industry. Ten-X offers a leading platform for conducting commercial real estate online auctions and negotiated bids. Homes.com is the fastest growing online residential marketplace that connects agents, buyers, and sellers. OnTheMarket is a leading residential property portal in the United Kingdom. BureauxLocaux is one of the largest specialized property portals for buying and leasing commercial real estate in France. Business Immo is France's leading commercial real estate news service. Thomas Daily is Germany's largest online data pool in the real estate industry. Belbex is the premier source of commercial space available to let and for sale in Spain. CoStar Group's websites attracted over 163 million average monthly unique visitors in the third quarter of 2024. Headquartered in Washington, DC, CoStar Group maintains offices throughout the U.S., Europe, Canada, and Asia. From time to time, we plan to utilize our corporate website, CoStarGroup.com, as a channel of distribution for material company information. For more information, visit CoStarGroup.com.
This news release includes "forward-looking statements" including, without limitation, statements regarding CoStar's expectations or beliefs regarding the future. These statements are based upon current beliefs and are subject to many risks and uncertainties that could cause actual results to differ materially from these statements. The following factors, among others, could cause or contribute to such differences: the risk that future media events will not sustain an increase in future occupancy rates. More information about potential factors that could cause results to differ materially from those anticipated in the forward-looking statements include, but are not limited to, those stated in CoStar's filings from time to time with the Securities and Exchange Commission, including in CoStar's Annual Report on Form 10-K for the year ended December 31, 2023 and Forms 10-Q for the quarterly periods ended March 31, 2024, June 30, 2024, and September 30, 2023, each of which is filed with the SEC, including in the "Risk Factors" section of those filings, as well as CoStar's other filings with the SEC available at the SEC's website (www.sec.gov). All forward-looking statements are based on information available to CoStar on the date hereof, and CoStar assumes no obligation to update or revise any forward-looking statements, whether as a result of new information, future events or otherwise.
