Podcast - The Art of the Sellout: Demand Drivers & The Booking Curve
Season 1: Episode 1


Join Daniel Foreman and Jeff Eskew from Lighthouse's Revenue Strategy Services team as they unravel the critical role of demand drivers in shaping the booking curve. Through compelling real-world examples, including a high-stakes college football game night and a routine midweek sellout, this episode reveals how to harness demand factors to optimize occupancy and revenue. Transform your approach to booking strategies with insights that empower you to make informed, data-driven decisions.
Have you been on a flight where the pilot 100% stuck the landing, and you barely even noticed you were no longer in the air?
Well, pilots have an expression for that: Buttering the bread
.
I propose we steal this phrase because let’s be honest, it’s way too fun, and we as Revenue Managers need better lingo!
Think about it for a minute… what’s the best thing we’ve got?
Perfect-sell?
Leaving Money on the Table?
Heads in beds?
Come on, we can do better!
When I was a Revenue Manager, I always thought of cleanly executing a sellout a lot like sticking a clean landing.
It was always a great feeling to set the hotel up for success, and the next morning check your reporting and getting that confirmation that you had hit 100% occupancy.
So here’s a thought experiment: consider all the factors pilots have to deal with, even during a routine landing: tailwinds, headwinds, runway conditions, talking to air traffic control, etc.
Just like pilots, Revenue Managers have a whole set of things we’re looking at too when we’re planning our approach for a perfect sellout…
Things like:
- Booking lead time
- Cancellation trends
- Market Segmentation trends
- Rate evolution of your hotel and the compset
- Demand drivers such as special events
- House Policies
- Oversell strategy
Let’s say you get just one thing wrong: you underestimate your demand drivers, and don’t accurately forecast demand. Revenue Managers know the embarrassment of selling out 6 months in advance, or sweating it out, hitting the perfect sellout in the (figurative) eleventh hour thanks to a last-minute walk-in. So how do we avoid simply being pushed along by the whims of the market and having a rough landing?
Well, think of everything that we’re doing in the background to combat unpredictability: demand forecasting by market segment, cancellation forecasts, asking other Revenue Managers about their experiences with similar situations, reviewing historical data, watching our competitive set’s pricing strategies, etc.
This led me to ask a question that I naively thought I could answer in maybe an afternoon if I put my mind to it: What’s a foolproof sellout strategy we can use every time to make sure we hit 100%?
Surely there has to be an ideal strategy, something like a landing checklist
that Revenue Managers the world over can use to hit perfect sellouts more often?
Perhaps an ideal number of days before arrival to reach 100%, a fool-proof rate strategy, or perfect market mix percentage that will ensure a sellout every time.
With our mission in mind let’s start doing some research and see if we can do just that…
This multi-part series will highlight these different factors that Revenue Managers should consider when planning a perfect sellout strategy. Along the way, I’ll showcase the different Lighthouse tools we use to uncover these kinds of findings, which are the same tools that you can use to determine the best plan of attack for your next sellout night!
If we’re going to answer a question as broad as “What’s the best way to sell out?!”, we first need to look at some sellouts and see if there are any key takeaways…
I started by putting the feelers out to our Revenue Strategy Services team to ask if anyone had any good recent sellouts that they could show me in Business Intelligence or Revenue Insight.
Thankfully it didn’t take long to find a great example: Jeff Eskew (Director of Revenue Operation) recently had 2 perfect sellouts at one of his hotels that he was willing to show me.
For pieces like this, I love looking at individual hotels with a story to tell. Pulling in the data in aggregate is great as well (check out some of the case studies we’ve done around hotel pricing/benchmarking during the Paris Olympics, or the “Taylor Swift Effect”), but analyzing data at a hotel level gives us a practical use case for combining our different products for deep analysis, and is a great representation of how I used our products when I was managing the day-to-day revenue management for my hotels. It’s also a huge help to have an in-house team of revenue managers!
Lighthouse’s RSS team is a team of revenue experts, who are constantly encountering, managing, and learning from all sorts of scenarios which allow us to further develop our best-in-class revenue management tools.
The examples used throughout this series are handpicked by real-life revenue experts selected as unique, interesting, or significant examples!
Analyzing the booking curve
The first factor I want to analyze is demand (such as special events) and the corresponding effect on the booking curve. I wanted to know what exactly was driving these sellouts, and how we, as Revenue Managers, can quantify, analyze, and adapt to these different levels of demand.
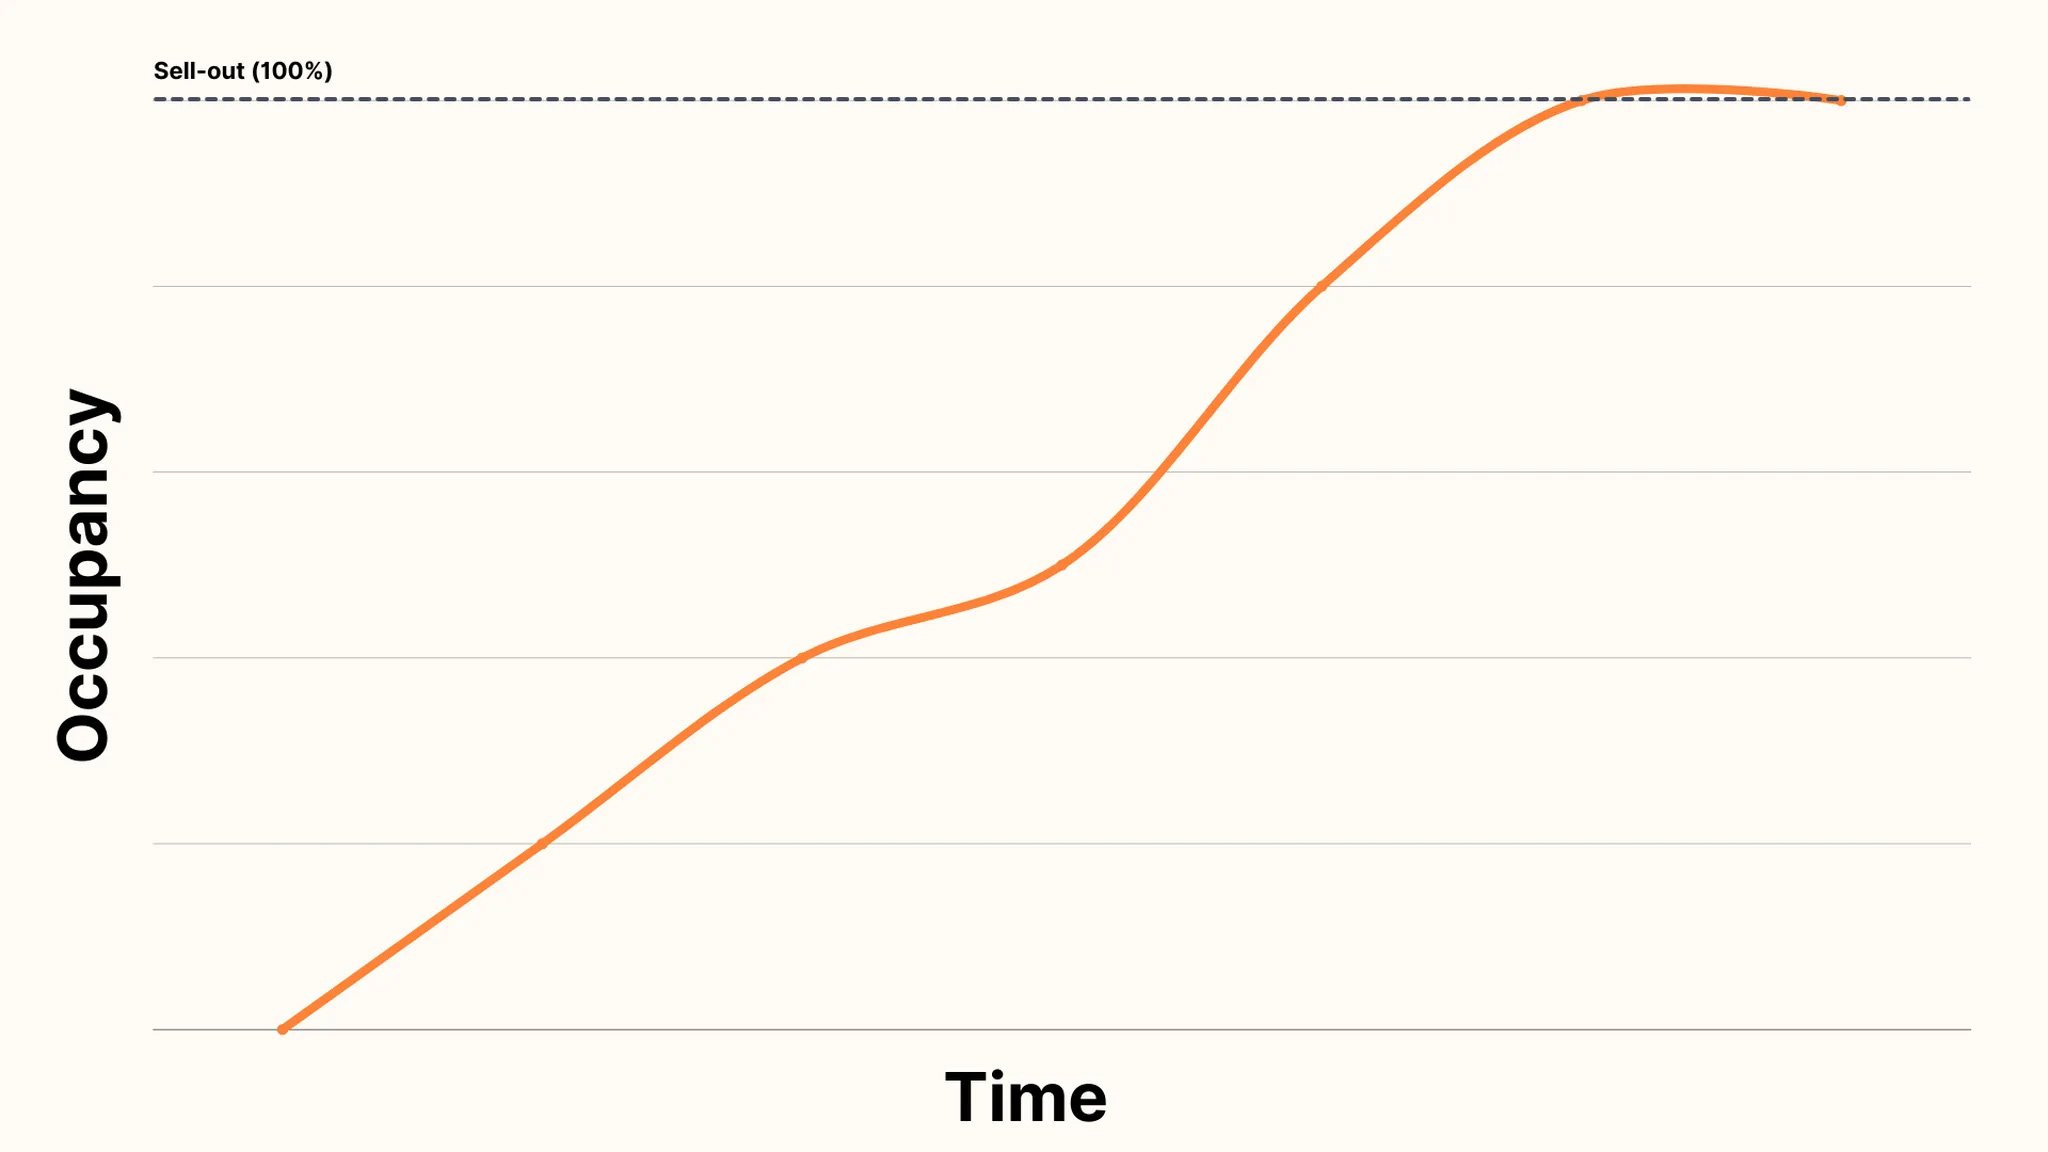
But first, let’s start by talking about the booking curve as we’re going to refer to it heavily throughout this series… To quickly define this term; the booking curve is simply how occupancy changes over time as you get closer to arrival.
Using the graph below, imagine that an event is announced for a date that has 0% occupancy.
As the graph moves from left to right, the date of arrival gets closer and closer. The vertical axis is occupancy, and the dotted line represents the goal: a perfect sellout!

To expand on this a bit more, by analyzing different booking curves we can start to tell a narrative. For example, take the chart below showing a green, orange, and gray booking curve.


We can make some assumptions about what causes booking curves like this. In my experience, booking curves resembling the green line may indicate that dates are likely underpriced. It's also possible that the Revenue Manager failed to notice a major event, leading to a rapid pickup in bookings.
The gray line represents a booking curve that signals the hotel may have been overpriced, or overly protected with restrictions, house policies, etc.. Notice that the hotel failed to reach a sellout.
The orange line is generally considered “better” as there is a steady increase in occupancy, signaling more control over the curve, likely due to better pricing, yielding, and policy strategies. The Revenue Manager gets to right around the sellout a few days before, and then the hotel executes the sellout with no issues.
Keep in mind these aren’t real booking curves (yet). These are just hypothetical booking curves that help to illustrate what makes a ‘good’ and ‘bad’ curve. So let’s look at some real examples!
An effective hotel sellout strategy for a city-wide event
First, let’s look at an effective sellout strategy over a city-wide event date. This hotel is in a college football market that had a record-setting weekend this fall. The game featured a big SEC rivalry (college football conference), and the opposing school is known to travel exceedingly well! This weekend was, even more so than Spring Graduation, the biggest weekend of the year!
A quick aside: I can’t stress the importance of recognizing events early enough. A lot of what I talk about throughout this blog will be a moot point if you aren’t able to spot events quickly enough and implement strategies to control your booking curve.
Check out the screenshot below of the “Events” tab in Rate Insight, where our revenue team identifies major and minor events in their market!


If you’re listening along with the podcast, the weekend I’m showing you now corresponds to the big football game that I discussed with my guest, Jeff Eskew!
Let’s take a look at the weekend in question in Business Intelligence and see how we performed! Take note of the actual peak night of the event, 10/07/23.


This was a fantastic weekend for sure, but what about our booking curve? How early in advance did we sellout? For that let’s head to Rate Insight to learn more about when we sold out, using Saturday night as our example (remember that this was the actual night of the event).


You may recall that this booking curve looks more similar to the ‘good’ hypothetical booking curve that we looked at earlier, and not very much at all like the other two, sub-optimal booking curves.
That said, notice that the hotel really started to approach the sellout at about 48 days out (this is where we start to breach that 95% threshold, or what I consider a technical sellout)! The hotel first reached 100% (or a true, perfect sellout) about 14 days from arrival.
Side note: My initial reaction was: “Wow we sold out way too early!” If you’re having the same reaction, keep reading, as I’ll show you how we actually performed vs. the compset!
Analysis: Cancellations remained a constant challenge throughout the booking curve
Here’s something crucial to remember though: when the hotel hit these occupancy milestones (95%, 100%), their occupancy didn’t just stay static! Cancellations remained a constant challenge throughout the booking curve.
To illustrate: In the final 40 days leading up to arrival, the hotel only had a net positive pickup of 2 room nights, experiencing 10 cancellations and 12 newly booked room nights.
This helps to illustrate just how much is really going on behind the scenes, and the pressure a Revenue Manager is under to “stick the landing” and hit 100% occupancy!
Technically the hotel “sold out” 3 separate times, owing to cancellations in the final 2 weeks!
That said, this challenge also posed a big opportunity: a chance to ‘trade up’ in ADR. As rooms cancel, rooms can be rebooked at higher ADRs, and in more desirable market segments if the Revenue Manager utilizes an effective yielding + pricing strategy (which we’ll touch on in later parts of this series).
This hotel for the big football game definitely “traded up” in the final days leading up to arrival, but many of these stays were points stays which were later reimbursed by the brand at a tremendously high ADR.
So how do we know that the Revenue Manager in reality did butter the bread? Well, take a look at the hotel’s performance vs. its competitive set:


This weekend was indeed a resounding success!! So let’s recap a few things that contributed to this.
A large part of this success is, in part, due to the longer ”runway” (more time at or above a technical sellout) that Jeff gave himself.
Newly created bookings slightly outpaced cancellations in the final days/weeks leading up to arrival, which allowed for him to trade- up and book some higher-rated rooms.
A word of warning, however - the risks associated with selling out too early are always the foregone room revenue from stays that would’ve been willing to book later in the booking curve at a higher ADR, so you must strike a balance.
Here, Jeff did that well, even if the higher occupancy happened quicker than what you may think is conventionally expected. I think this goes without saying but here Jeff buttered the bread. Nice work Jeff!
Rating: (5/5 sticks of butter)
An effective hotel sellout strategy for a non event date:
Let’s change gears and look at a different kind of sellout - a few weeks before the football game, Jeff’s hotel also had another perfect sellout, but this day was a more routine Wednesday night, with no city-wide event.
For this particular night, there was strong corporate demand and a bit of a group base, which isn’t out of the ordinary (shown below in Business Intelligence).


Here’s the booking curve for this different type of sellout night in Rate Insight:


Look how much more extreme the slope of the booking curve is on this day, even with several pieces of group business booked 114 and 70 days out! The hotel sold 63 rooms in the final 11 days leading up to arrival!
This speaks volumes about the importance of demand drivers. Virtually everything about the second example shown here and the first example of the football game is different.
Different days of the week, demand drivers, pricing strategy, different yielding strategy, different house policies, etc.
To state it plainly: the stakes were generally much lower on this particular date.
Using Business Intelligence to compare the market mix of the 2 nights, you can see just how different things really were from a segmentation perspective. (But don’t worry, we’ll talk about segmentation in more detail in a later installment):


Looking at the booking curves of the two scenarios -non-event (green) vs event (orange) - they are completely different. For the non-event date, the booking curve lags behind as much as 60 days behind the event date.


Key Takeaways:
- Catch events early enough to fully control the booking curve
- Time spent at or above the technical sellout before the day-of arrival isn’t always a negative. Cancellations offer an opportunity to ‘trade up’ and re-sell those rooms at a rate premium.
- Consider a longer “runway” for extremely high demand dates. If you’re used to sweating it out and selling-out day-of, consider starting small and selling out a few days before, and then take note of the effects this has on your performance.
- Do not think of major event dates and high-demand, non-event dates the same, expect them to behave differently!
- Dates with more routine demand drivers don’t need as much ‘runway’. Pickup is generally more last-minute.
About Lighthouse
Lighthouse (formerly OTA Insight) is the leading commercial platform for the travel & hospitality industry. We transform complexity into confidence by providing actionable market insights, business intelligence, and pricing tools that maximize revenue growth. We continually innovate to deliver the best platform for hospitality professionals to price more effectively, measure performance more efficiently, and understand the market in new ways. Trusted by over 70,000 hotels in 185 countries, Lighthouse is the only solution that provides real-time hotel and short-term rental data in a single platform. We strive to deliver the best possible experience with unmatched customer service. We consider our clients as true partners—their success is our success. For more information about Lighthouse, please visit: https://www.mylighthouse.com.