Forecasting and Optimizing Digital Media Mix for Hospitality: Let’s get practical!
Last week, I spoke to Suneel Grover, senior solutions architect for digital intelligence at SAS, about how better data and integration can drive improvements in web analytics. This week I wanted to see how this could be applied for a hospitality company. We decided to tackle a frequently debated topic in marketing: how digital media mix can impact a firm's set of business objectives. I asked Suneel Grover to walk me through how he would answer this question using methods that could be used and understood by a business user. Suneel used SAS Visual Analytics to show me how he would optimize digital media mix to increase website traffic by 50% in a forecasted time period.
Step One: Forecast future visitors
Suneel began by accessing digital clickstream data at a level of aggregation specific to summarizing individual session behavior (not simply overall clicks or page views). This approach provides a granular data view of individuals visiting a digital property, allowing for flexibility in ad hoc analysis. An example would be a guest who visited a hotel website 8 times over the last month, we would have a record of those 8 visits assigned to that individual. This kind of data is not available with typical web analytic reporting tools, but can be accessed when an organization modifies their digital data collection methodology to transform web analytic third party data into its own first party data source. When it becomes your own data, you are free to aggregate, modify, and manipulate it to support a variety of downstream analytic goals – from reporting and BI, to predictive analytics and data mining. Ultimately, the intention is to liberate yourself from the analytic limitations of traditional web analysis, and increase your organization's level of digital intelligence.
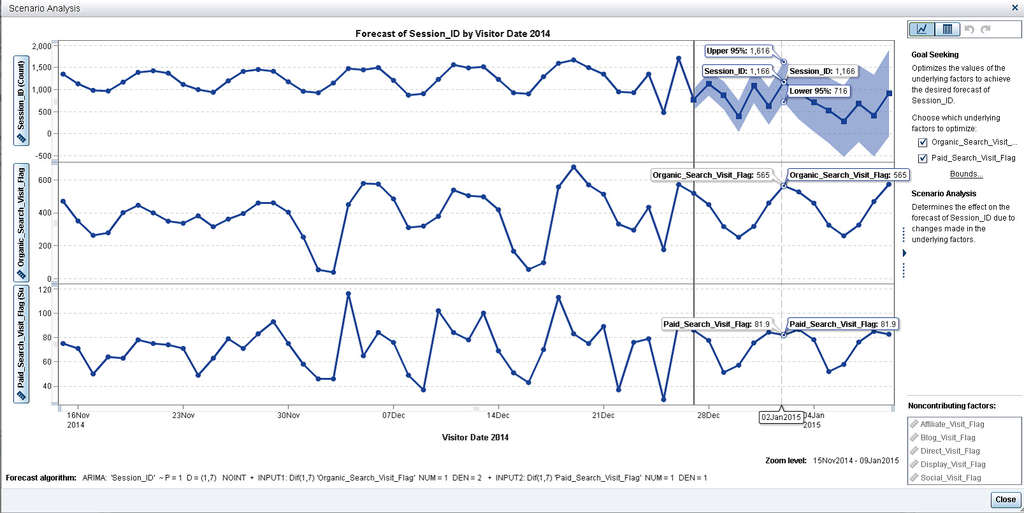
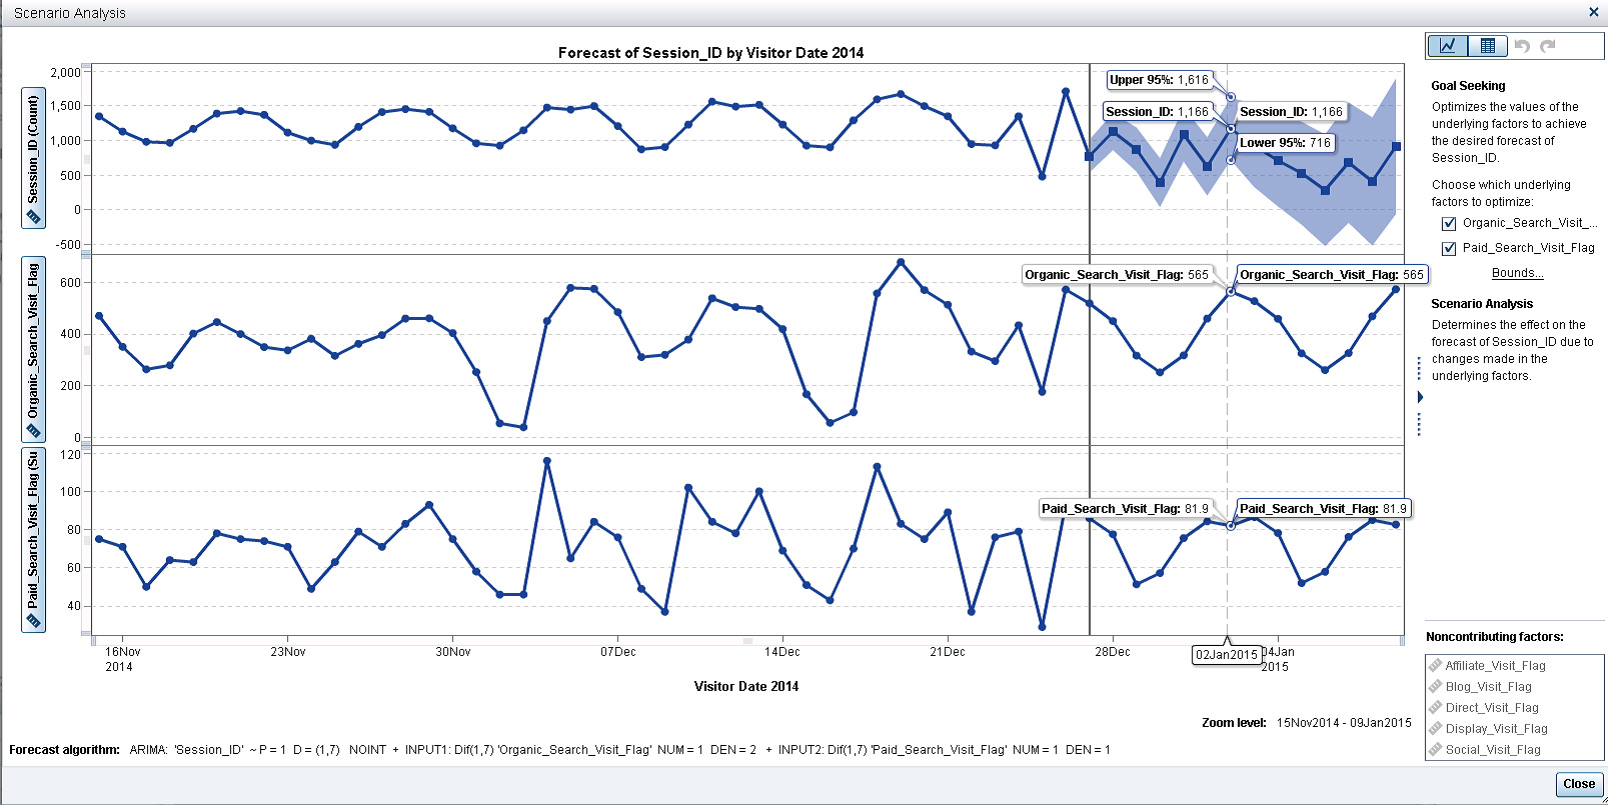
Suneel created a forecast in Visual Analytics by first plotting the historical web traffic visitation. In this case we produced a line chart that displays Session ID by Visitor count. This indicates how many individual visitors (sessions) visited your site between certain dates.
Next, he created a visual of the forecast. In this instance Suneel selected to forecast for the next 14 days. To obtain the most accurate prediction, the technology uses a champion/challenger modeling approach which leverages six different forecasting algorithms. After applying the math, the software makes an assessment of which algorithm produces the most accurate answer (based on a statistical test) and displays the champion forecast with a 95% confidence interval. To this he added seven underlying factors (i.e. traffic referral sources such as display ads, social, search, email, etc.) to help identify the important digital media channels and further improve the forecast model's accuracy. Both Organic & Paid Search were identified as statistically significant referral traffic sources with respect to the forecast, so as a result are featured in the visualization shown in Figure 1.
Step Two: Running What-If Simulations through Scenario Analysis
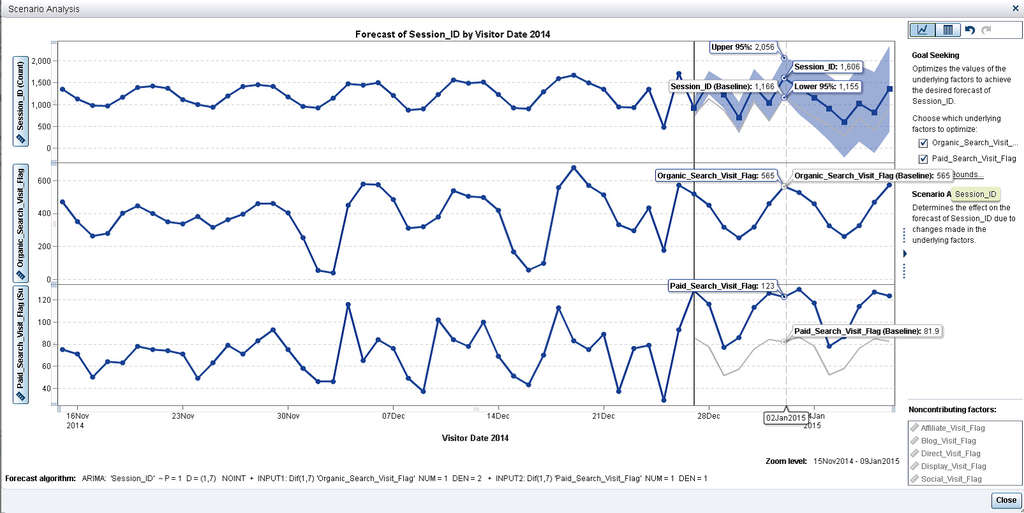
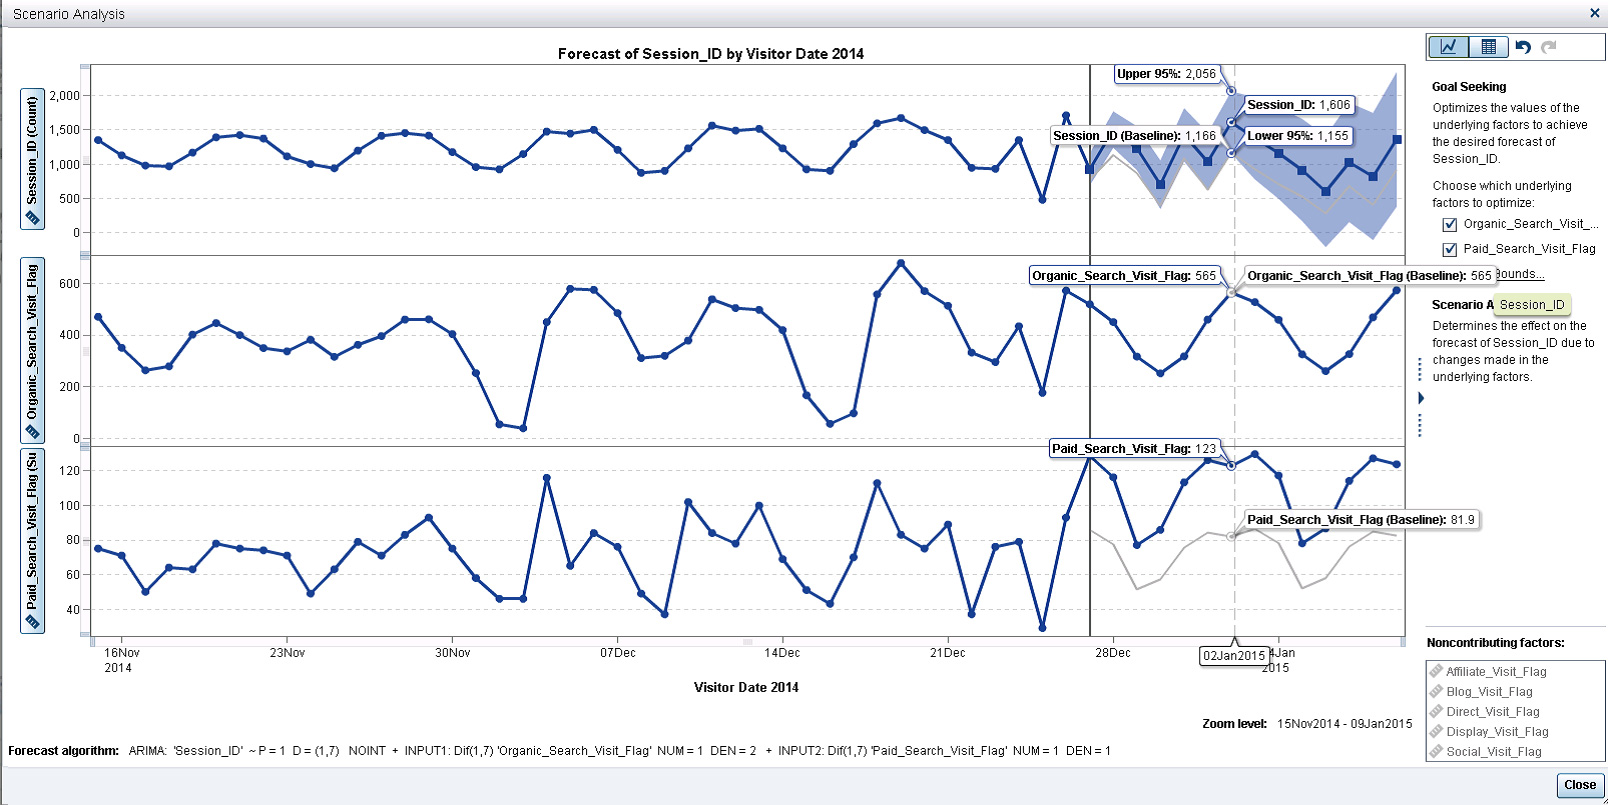
Using the forecast prepared in Step One, Suneel adjusted the forecast to explore potential what-if scenarios. He did this by addressing the following question: "If we increased our paid search advertising spend by 50% in the forecasted time period; how will this impact overall site traffic? Suneel adjusted the future values of paid search traffic by 50% for the duration of the forecast. Once he applied that adjustment he was able to assess the incremental impact of increasing the effect of paid search on the forecasted global site traffic, as shown in figure 2.
Of course, as soon as Suneel was able to produce a result for a 50% increase in paid search advertising, I wanted to know what the results would look like if we varied the simulations with increases of 15%, 25%, or even 35%. Suneel agreed that running multiple scenarios was one method of approach to arrive at a decision recommendation on how much money should be allocated into a specific digital media channel. However, he suggested an even more powerful idea to arrive at an optimized solution to this digital media channel allocation exercise.
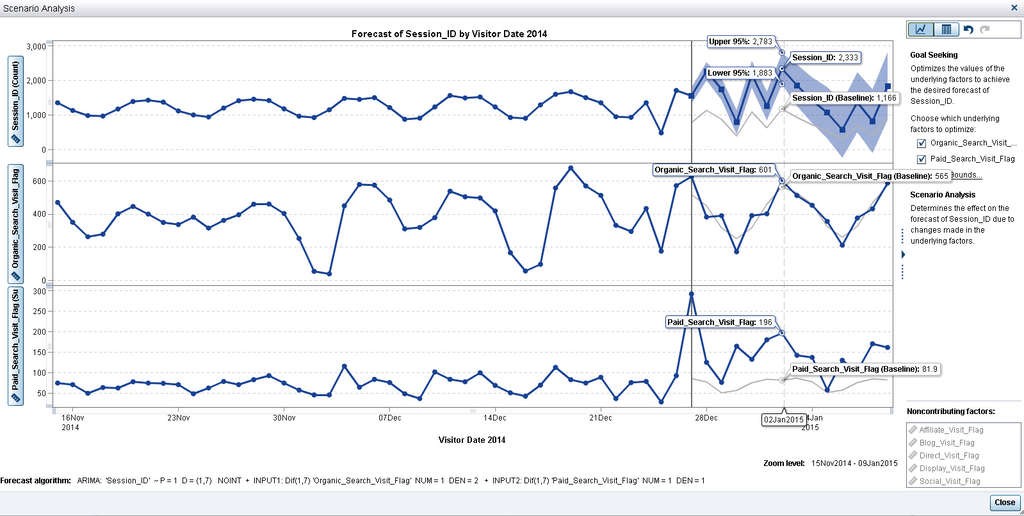
A new feature released in SAS Visual Analytics 7.1 during the fall of 2014 was Goal-Seeking. Suneel continued to explain that running simulations on varying the potential impact of one digital media channel has tremendous value. However, at the end of the day, we need to address an overall business objective of increasing website visitation. Rather than manually adjusting the levers of each digital media channel, let's get straight to the heart of this problem, and request the software to optimize the values of each digital media channel to reach our business objective. This is what the SAS Visual Analytic technology is built to do – run complex math very quickly on large volumes of digital data and arrive at a data-driven insight. He reset the scenario in Visual Analytics and applied a new adjustment of 100% to overall site visits – in essence, we want to double website visitation in the two week forecasted time period. Now tell me – how are we going to get there?
Once we had the results, we proceeded to review the results, and identify any areas of concern.
Step Three: Assess the optimized scenario and apply business constraints.
One result that immediately jumped out to us was the level of spending required on a specific day to obtain the volume of paid clicks that would drive a 100% increase in individual visitors. Suneel knew that marketing leaders would balk at that level of investment, so decided to assign upper and lower constraints to allocations to paid search and control the level of daily spending on pay-per-click ads. Suneel used a lower constraint of 0 and upper constraint of 250. Once applied, he re-visualized the forecast with the constraints applied. The results can be seen in Figure 4.
In summary, Suneel's analysis resulted in the identification of more important (and less important) digital media channels with respect to forecasting website visitation. After identifying that Organic and Paid Search were the two most important media channels in predicting future traffic, he proceeded to highlight approaches of running scenarios (or simulations) of varying the impact of one digital media channel. Ultimately, utilizing goal-seeking (i.e. optimization) and business rule constraints, Suneel arrived at the optimized values required by ALL digital media channels to reach an overall business objective of doubling website visits in a specific time period. One could suggest that this is an example of prescriptive analytics!
How do you identify what impact the increase or decrease in digital media channels will have on your website traffic?
Angela Lipscomb
919-531-2525
SAS Institute Inc.
